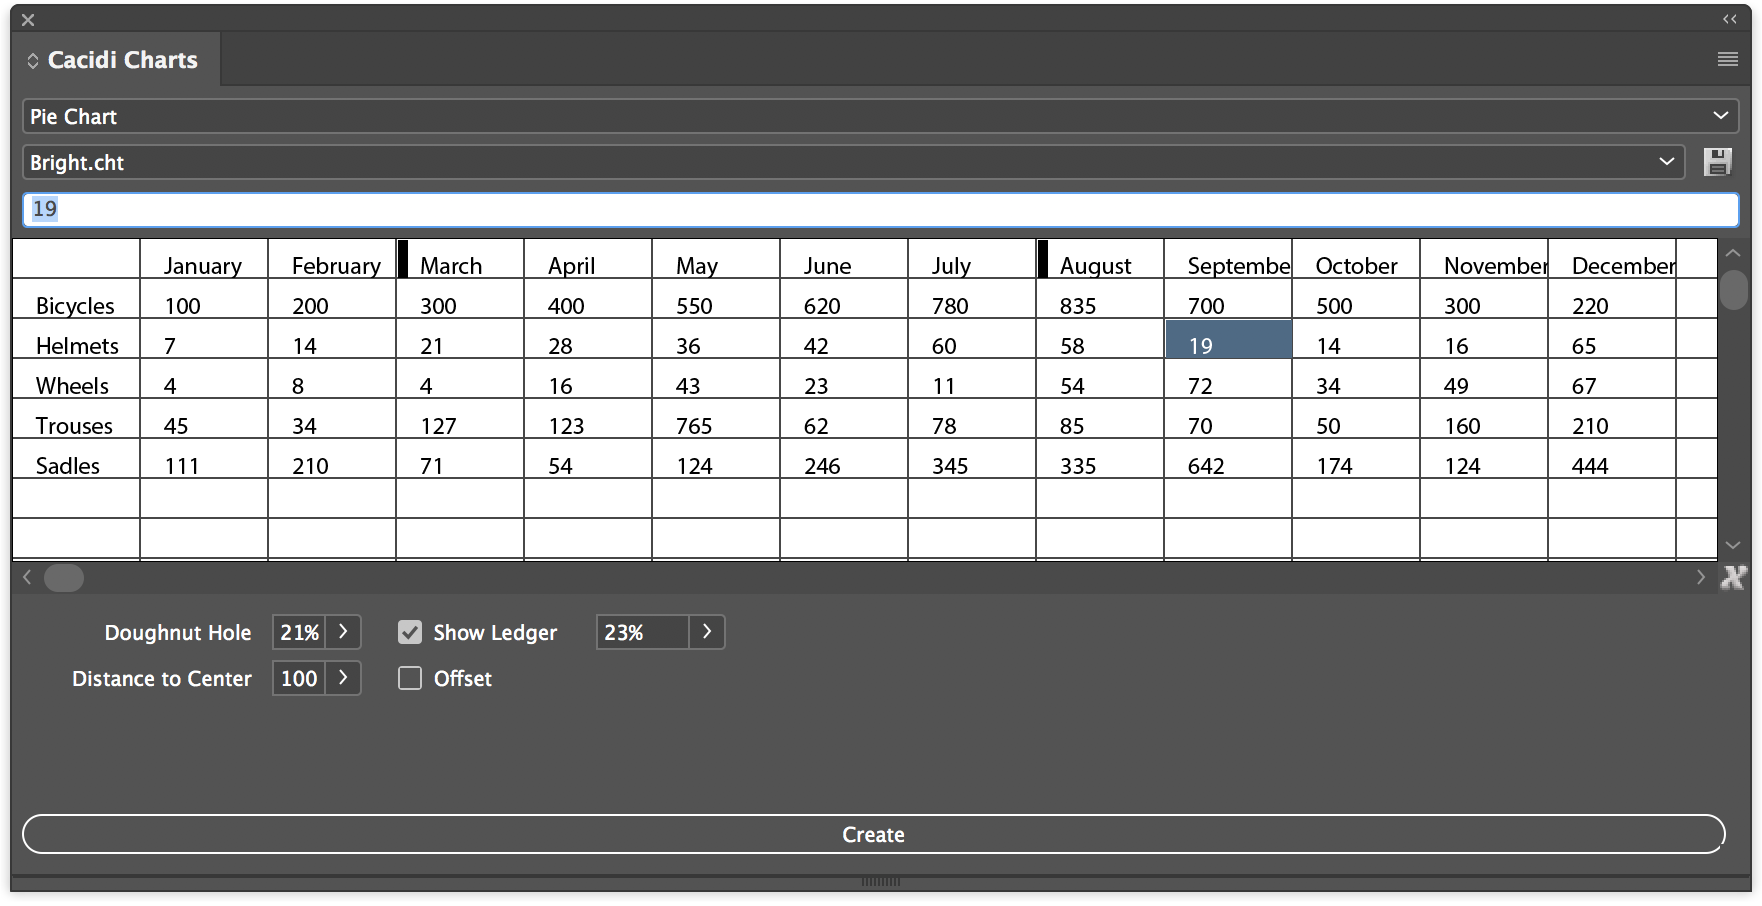
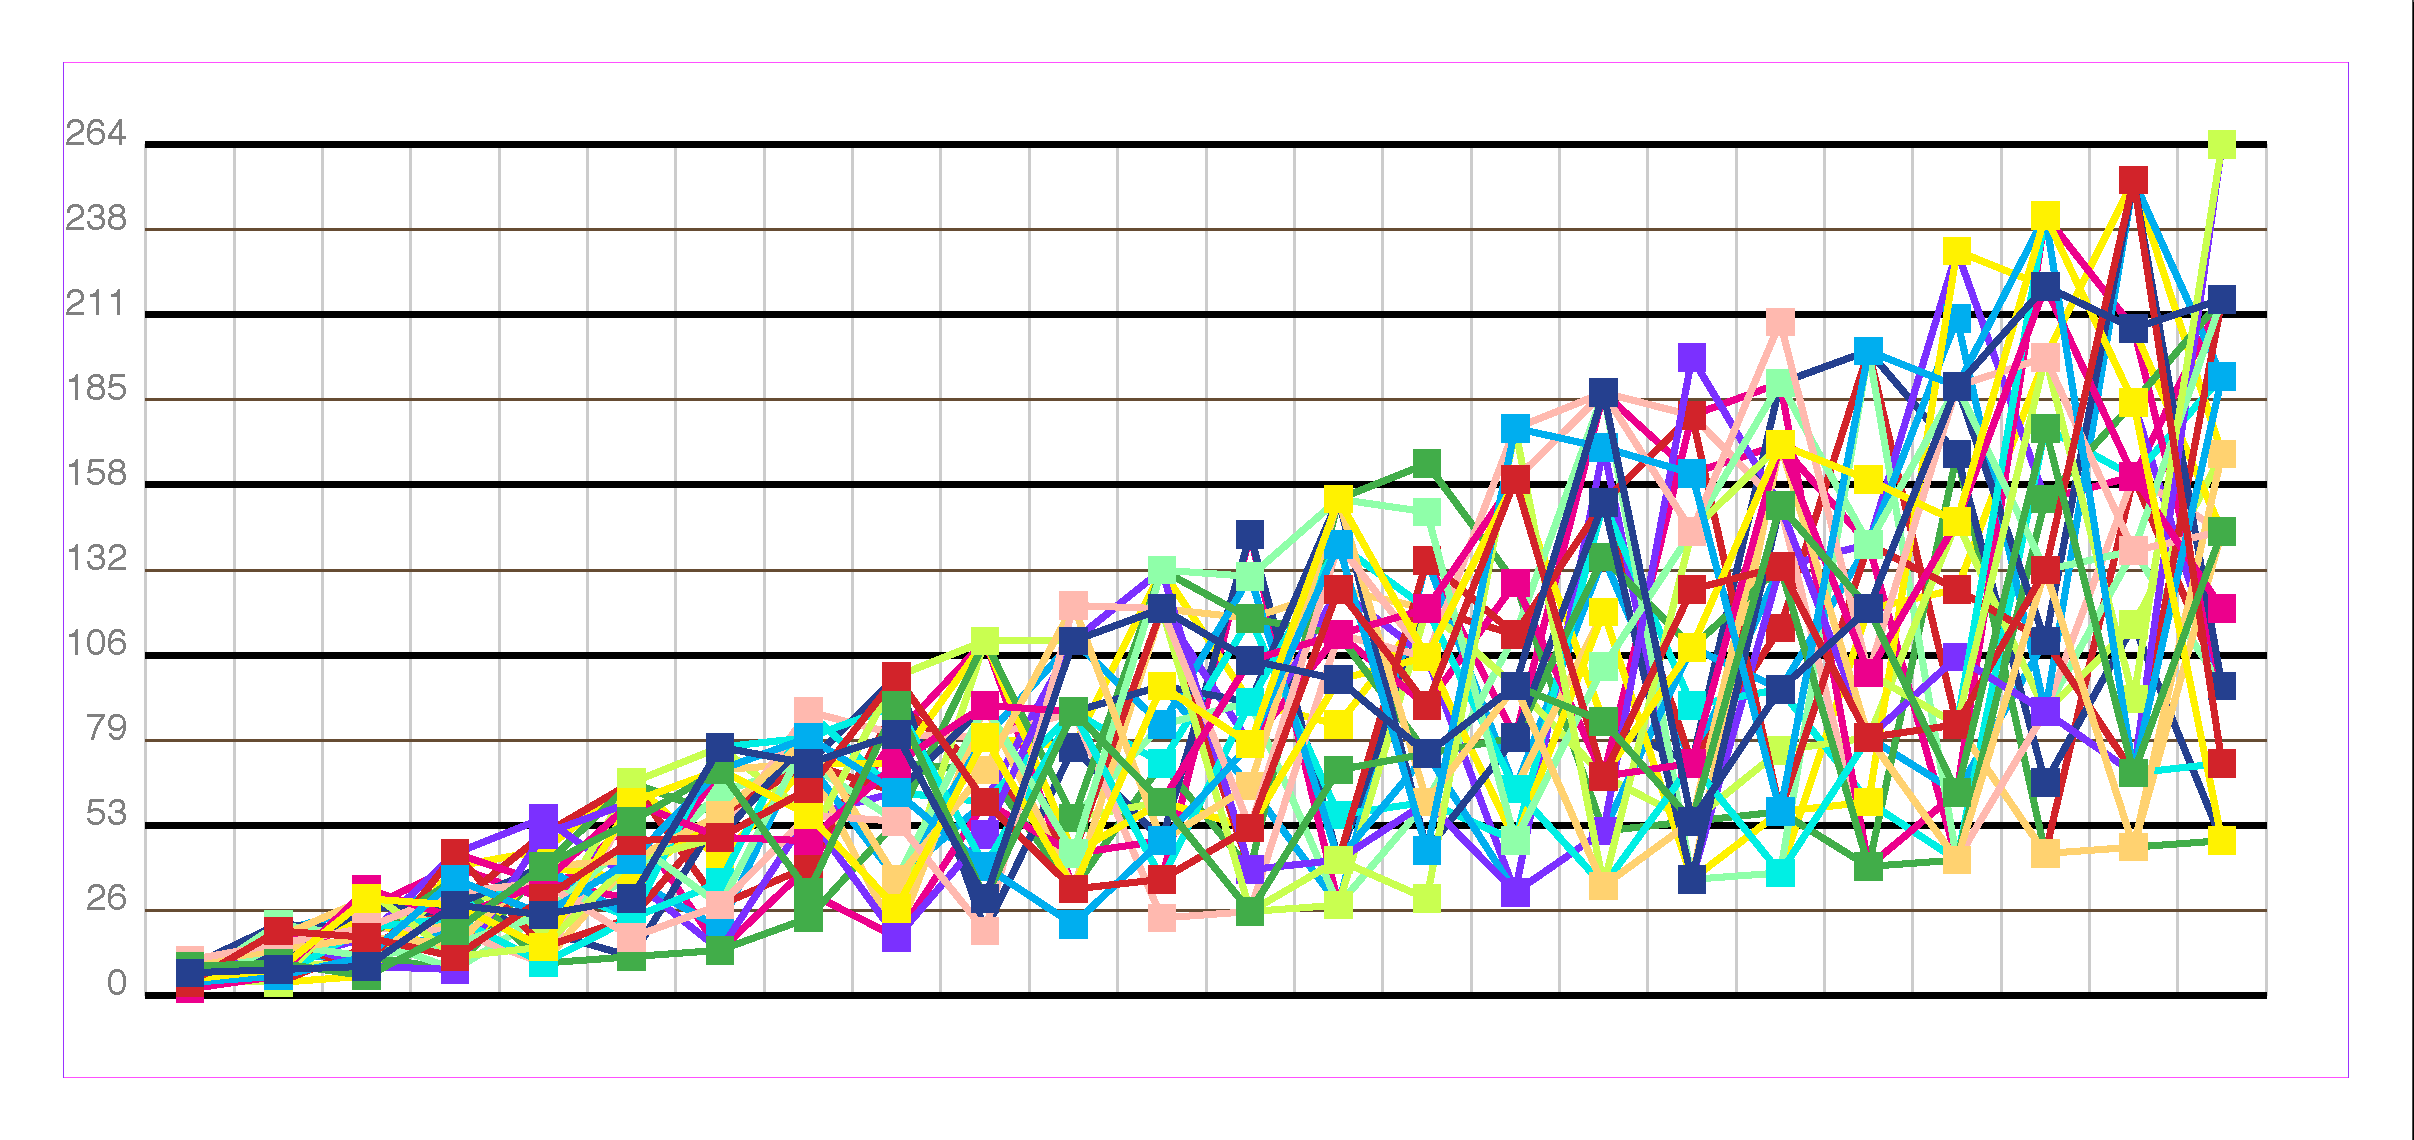
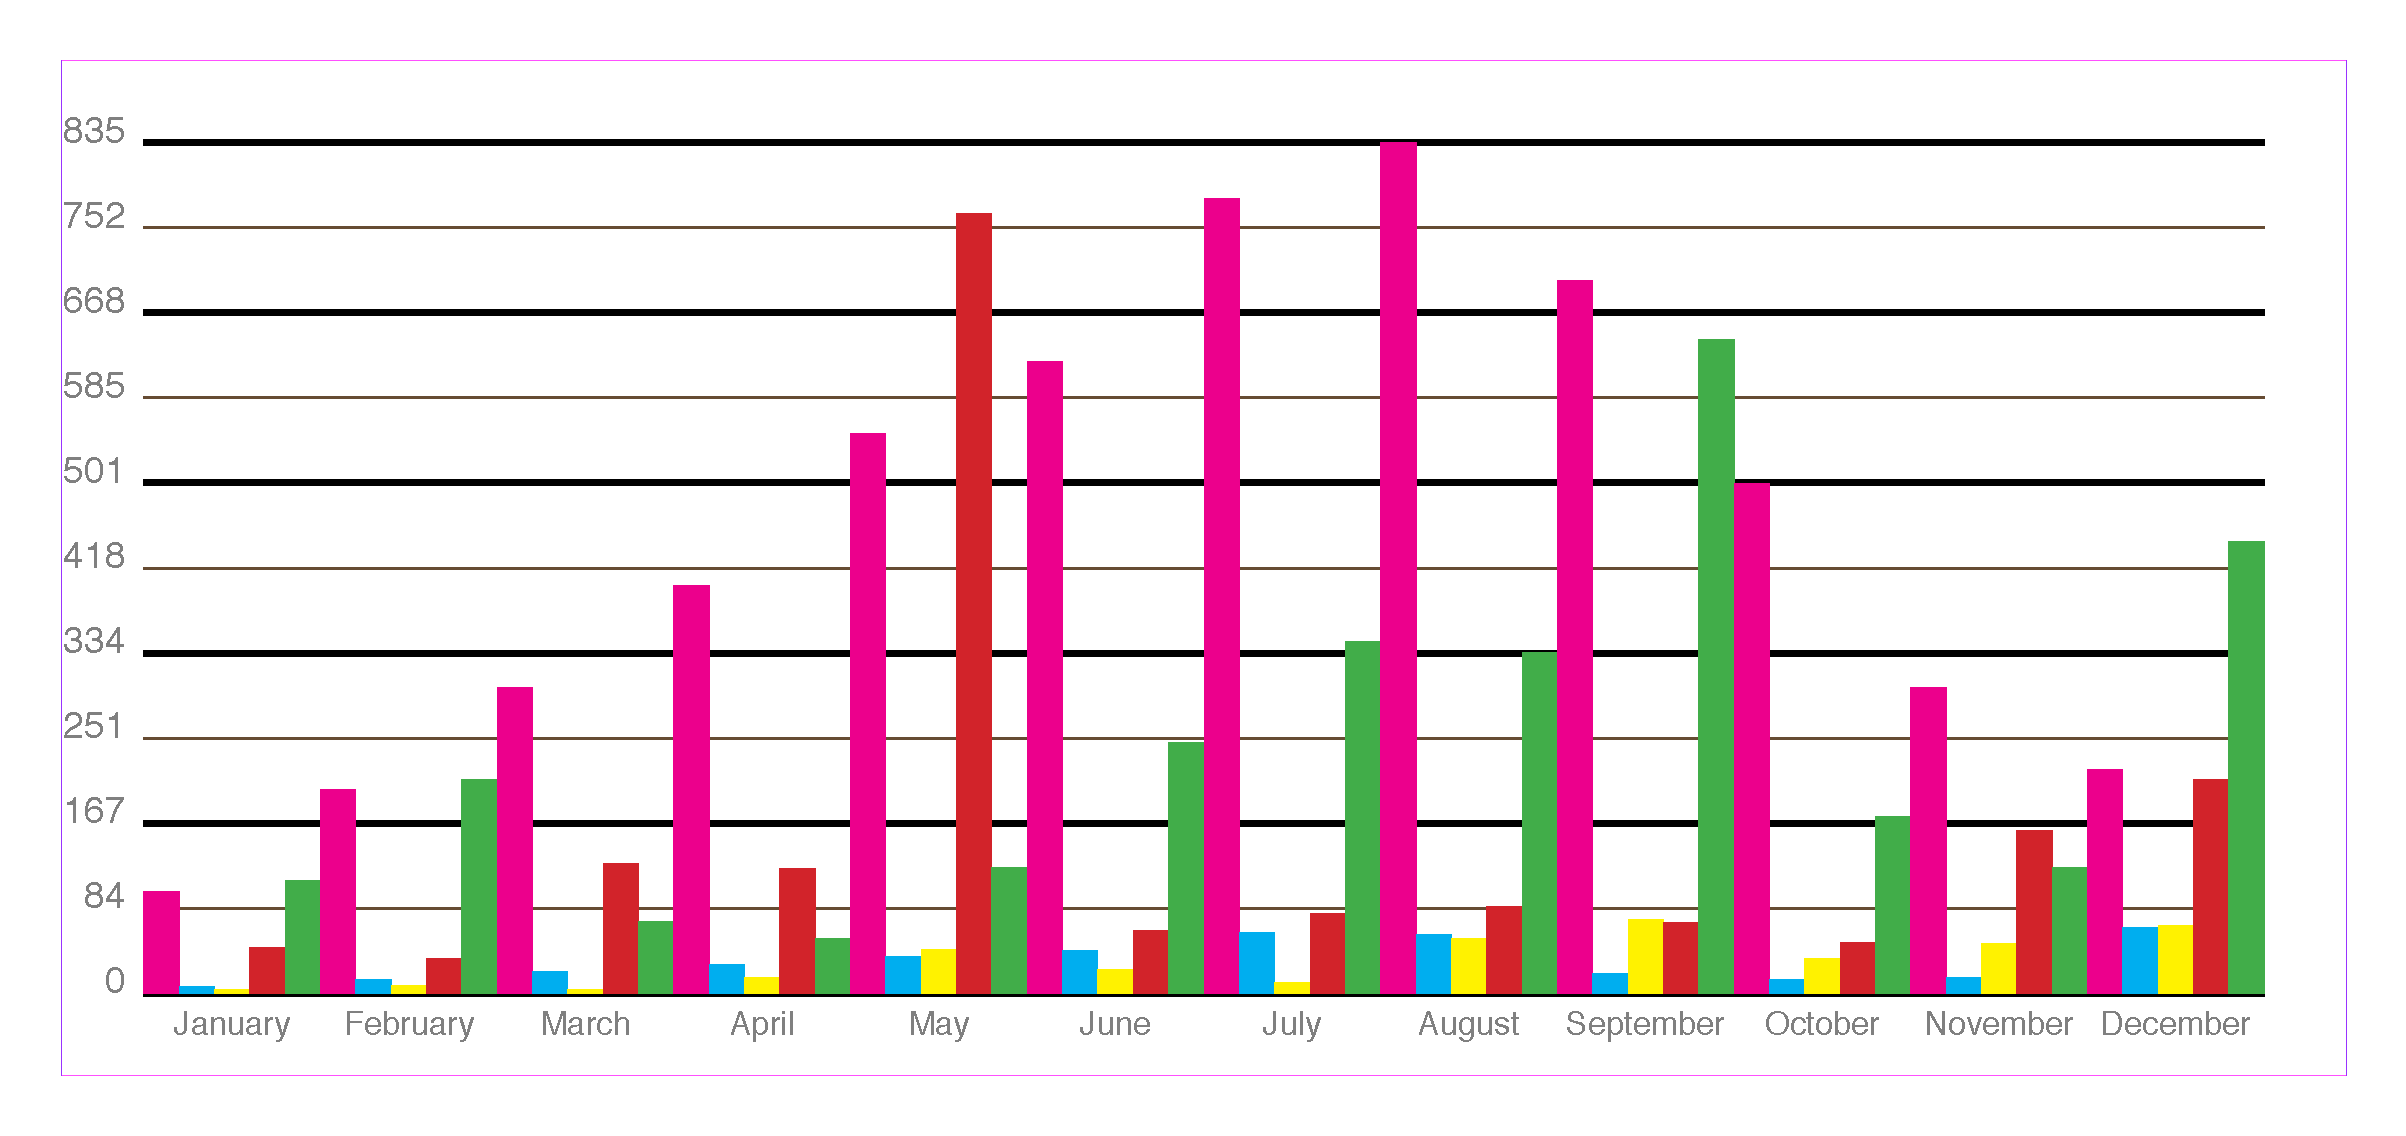
 Today Cacidi are announcing a complete world class solution for creation and editing charts directly in Adobe InDesign. The many charts available covers Pie Charts, Column Charts, Bar Charts, Stacked Charts, Area Charts and the combined Line Scatter Charts. A wide range of charts, and some of them even makes it possible to combine functions like making first row as a line, when working with Columns Charts.
We invite you to be a part of a public beta phase, will planed release be the end of August 2017, download the installer package from the download page. After the public beta period the license can be purchased here.
 Cacidi Charts gives live update of all settings, data as well as appearance can easy be adjusted and all are on-the-fly redrawn. Size adjustment of the charts will auto redraw and e.g. lines in the background will using our custom algorithm be re-calculated.
Color styling af the charts can be controlled by creating user determined styles, and a lot of settings like space between columns, lines in the back ground of charts, values can be shown and for Pies, a doughnut hole can be adjusted and some slides of the pie can even be offset from the center.
 Automated creation of charts can be done using Cacidi Extreme CC or Cacidi LiveMerge CC, for both, all setting of the chart will be a part of the snippet, and data can flown into the chart fully automatic.
100% scripting support, for Javascript, AppleScript and Visual Basic. Full creation of the chart with all settings and styling of the chart.
