Display Data
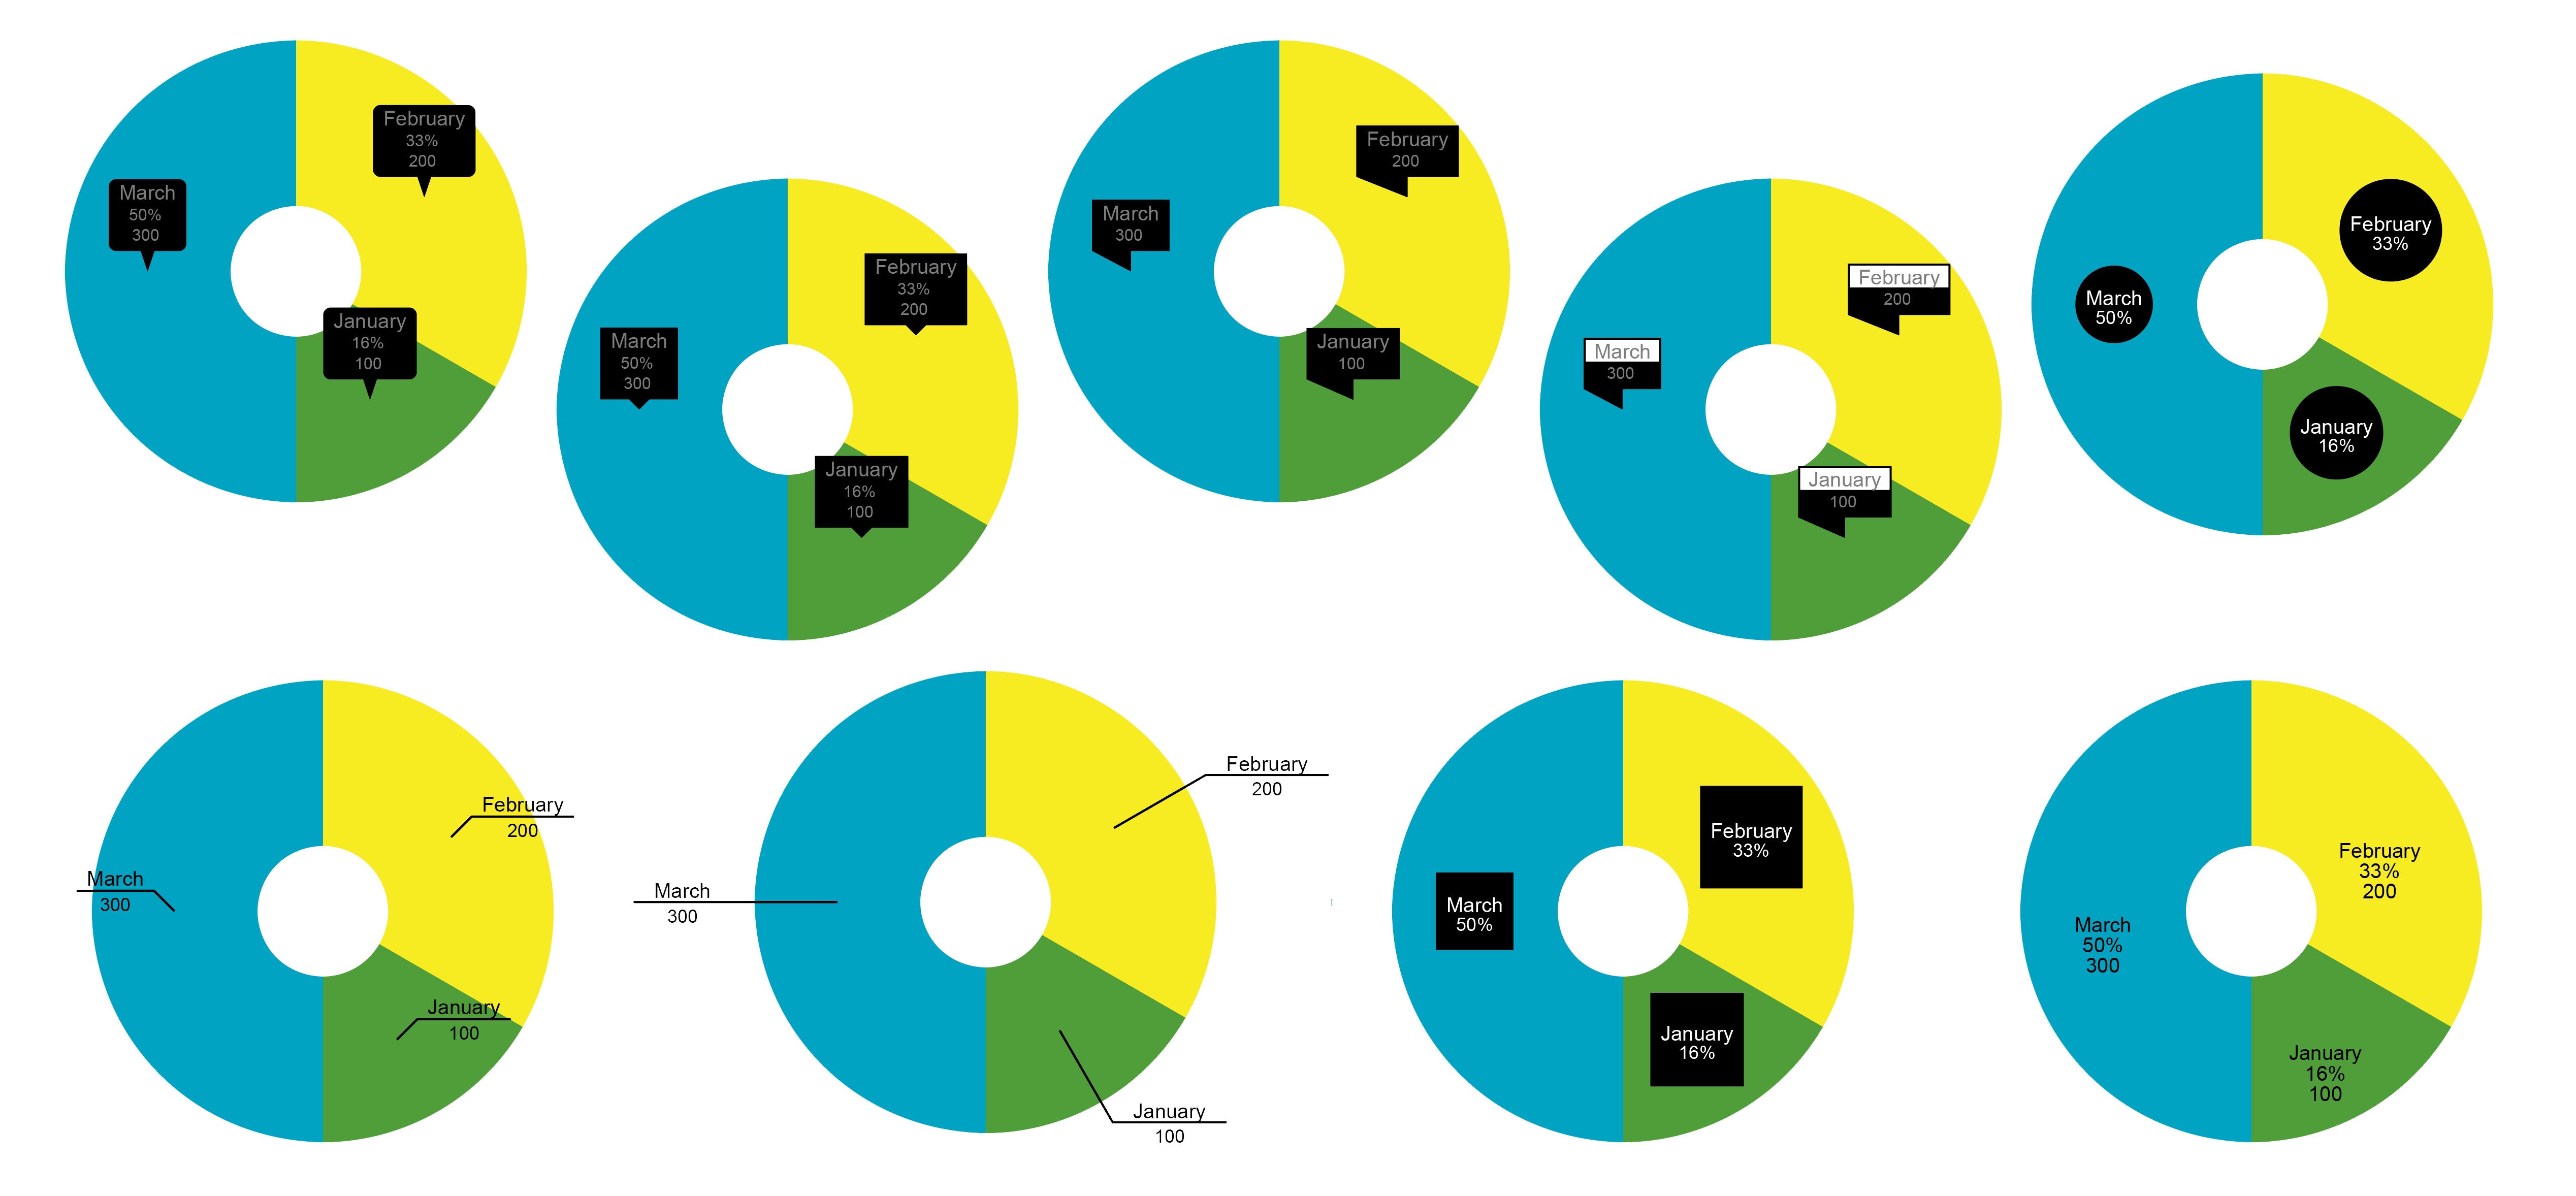
There are a number of ways to display data of the charts.. As data just outside the graphic elements, like show x-values and y-values, or by using the Callout function.
Calculated Rounded Values
The Calculate Rounded will use an algorithm tried top calculate nice rounded values instead of exact values.
X-Values and Y-Values
The show x-value and y-value display, simply shows a value depending on the position, like 0-100 on the y-axis, og the header data at the x-axis on a column chart. On rounded charts like Pies, the data are displayed just outside the curved side.
Using Callouts
Callouts are small sign (9 different types), that can display different data. Values, Totals and/or Header data. simply by choosing which needed.

