Options for graphs
General Settings
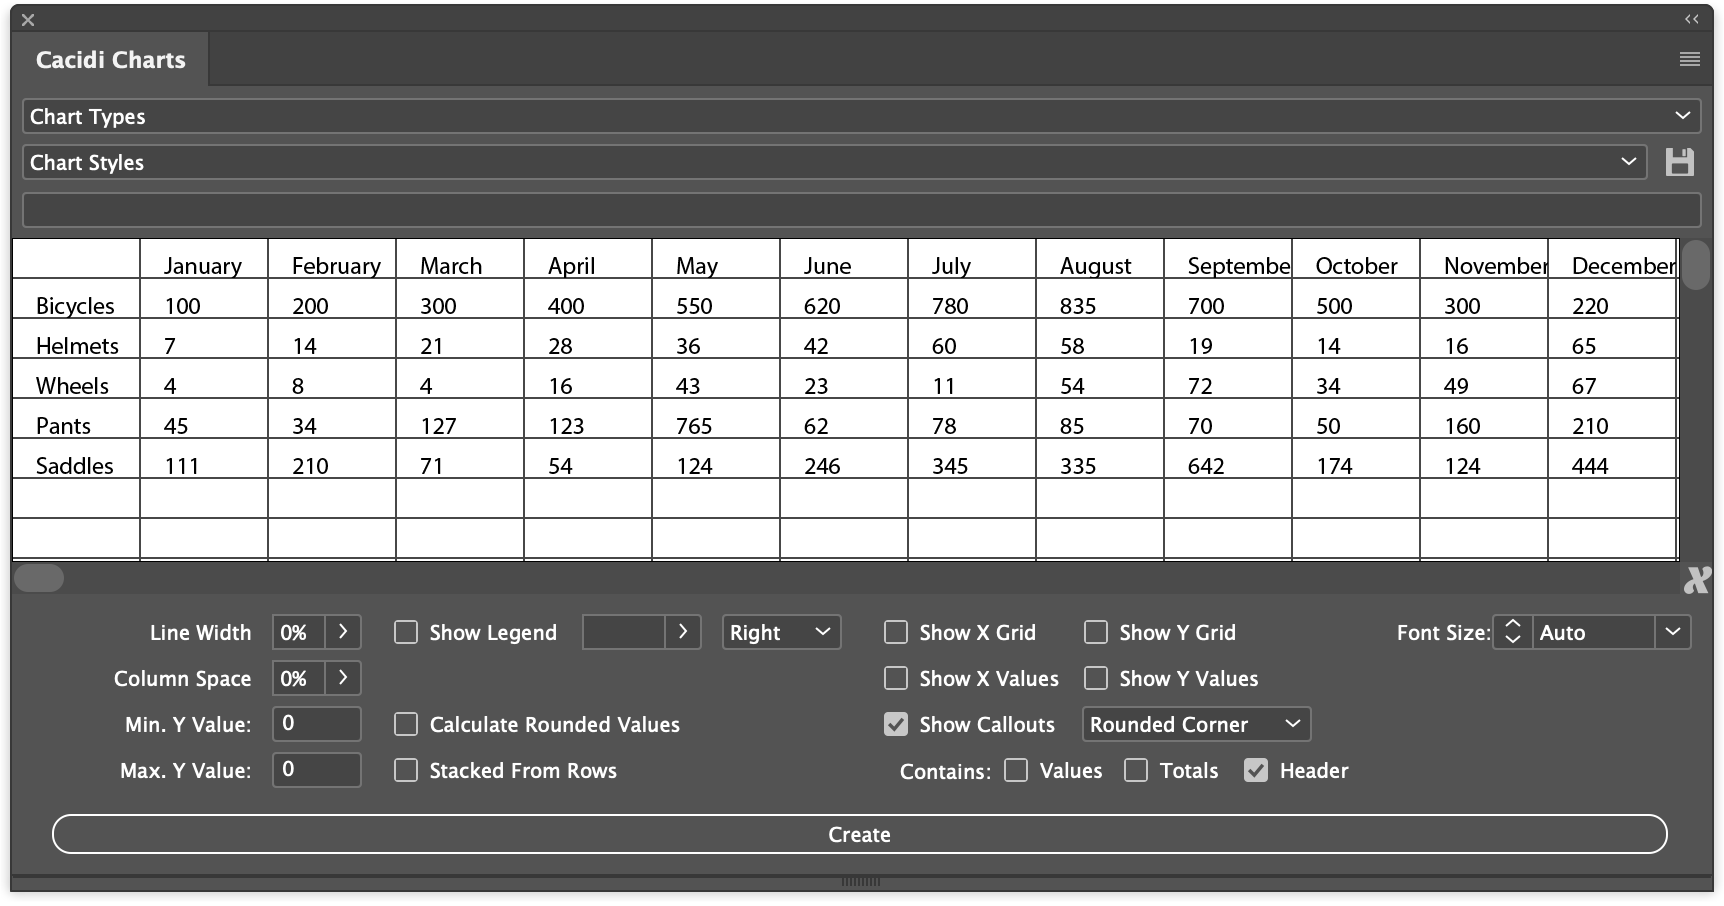
Max. Y-Value: a maximum value to adjust the data value maximum. When using the Max. Y-Value, the value must be the sum of the row that the chart will use.. To help with the calculation of the value, a menu point in the palette fly-out menu can be used. Select the row, the select the "Calculate Row Totals", and the row totals are calculated and the data is inserted in the Max. Y-Value field.
Line Width: The slider "Line Width" indicates the thickness of the background row if "Show X Grid" is turned on. Valid values 0-100%, the real thickness of the line is based on algorithms about calculating the graph size.
Show X Grid: The checkboxes indicate whether X and / or Y lines below the graph should be displayed.
Show X Values: Display of values below and to the right of the graphs itself can be turned on or off.
ShowLedger: When check box's "Show Ledger" is turned on, the slider can be adjusted for size . The popup menu, showing "Left, "Right" "Top", "Bottom", allows for selecting position.
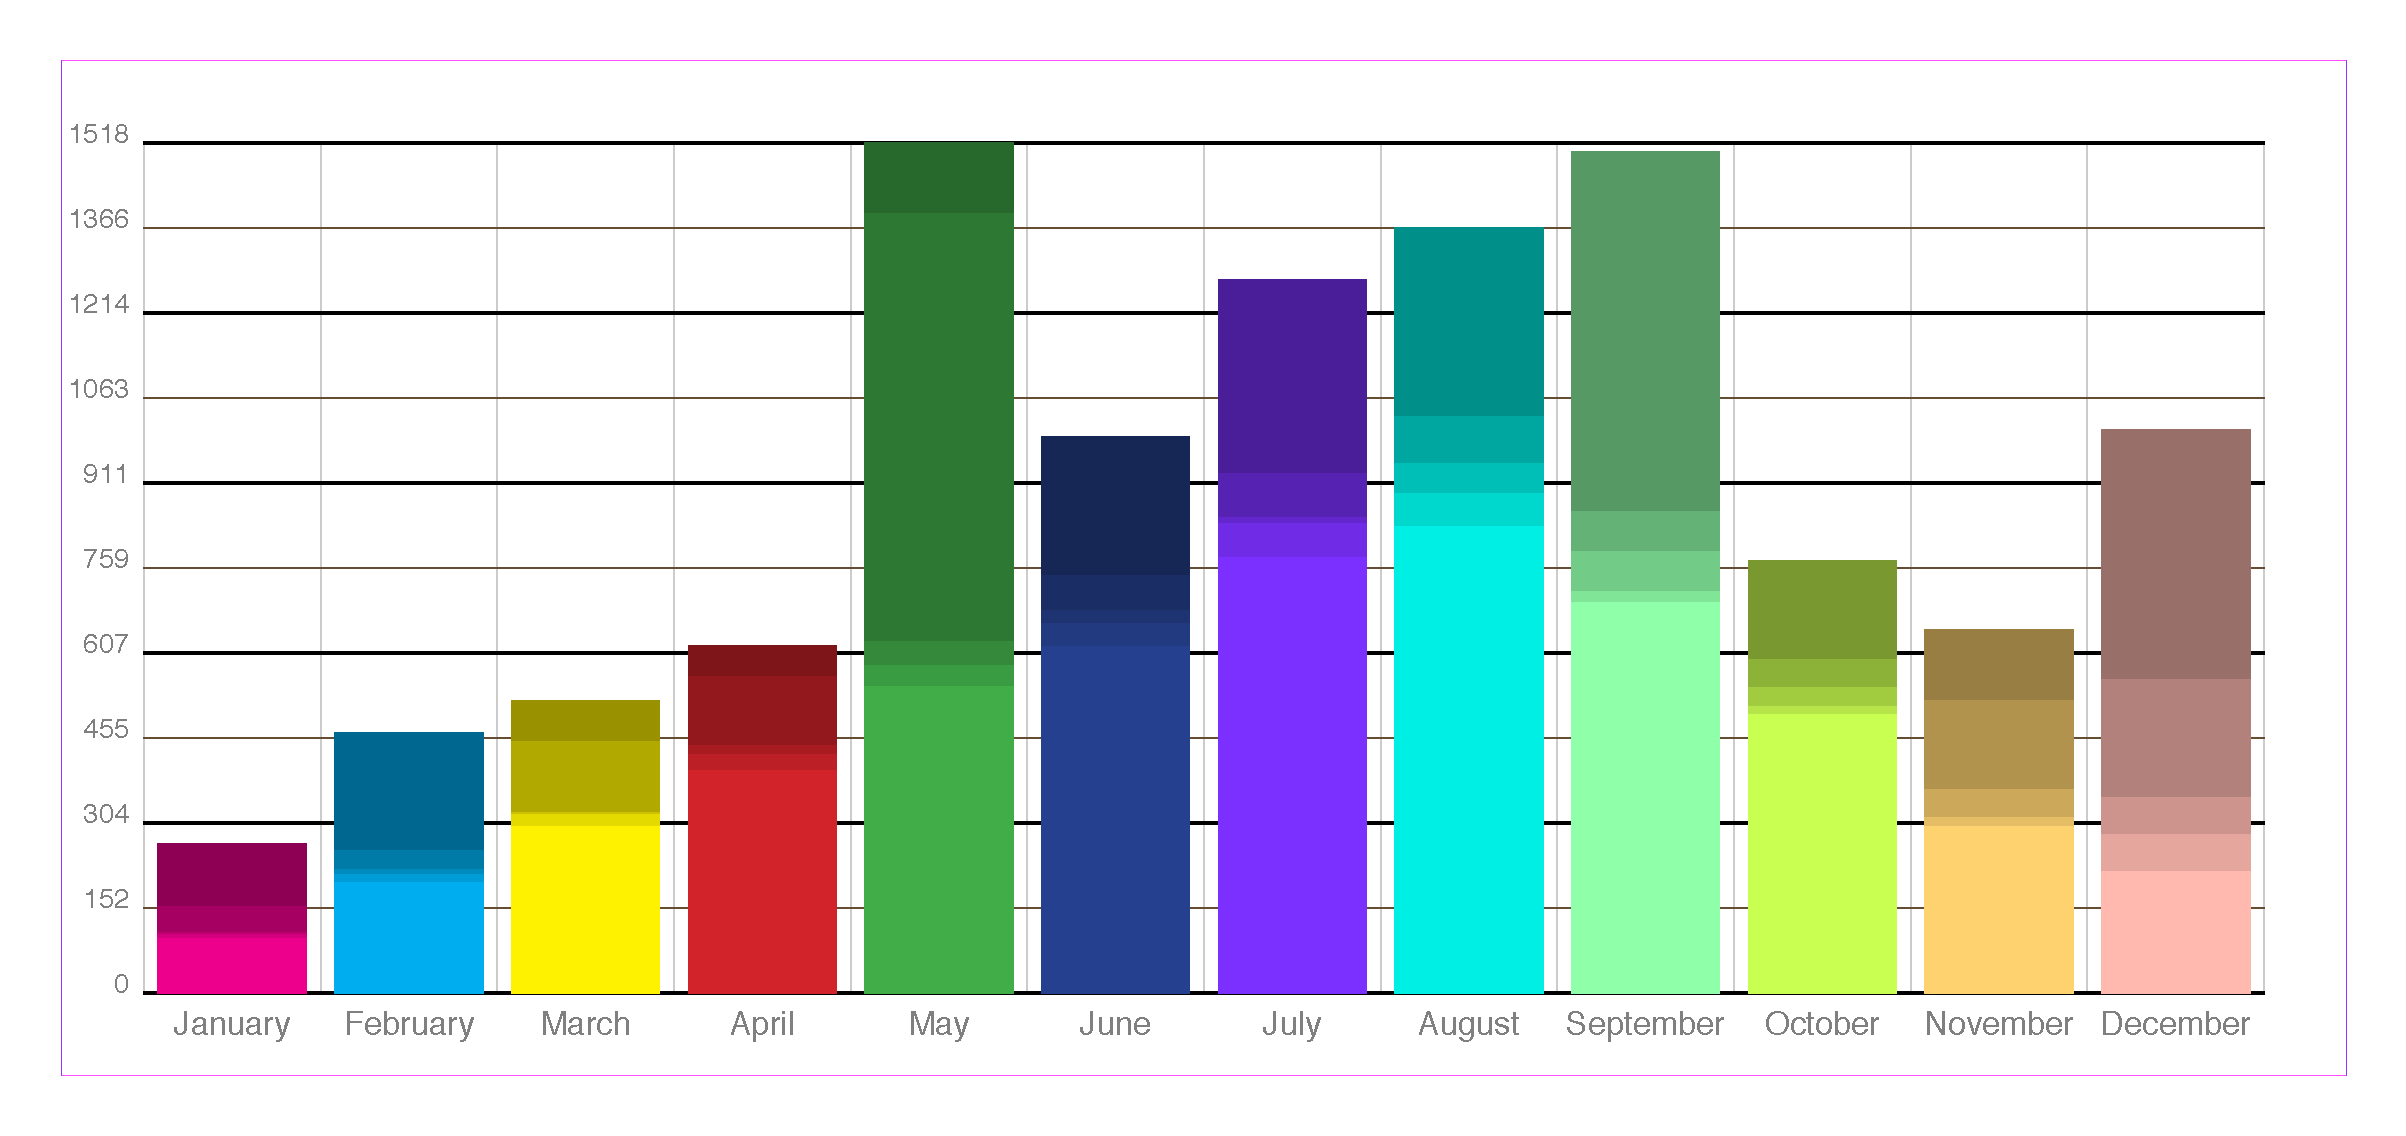
Stacked Charts: Almost any charts can have stacked data, meaning that the row data stacked (from all rows), are the total of the column. Any, except High/Low can use the stacked data function.
Rounded Values: Beautiful numbers like 100, 200, 300, can be chosen instead of exact numbers.. Our algorithm calculate nice rounded values, no mater if it’s large or small values.
Rounded x/y-values: Just like the square charts e.g. column or bar charts, the rounded charts can now have grid and values displayed.
Callouts: 9 types, For displaying data there a not just the regular x-axis/y-axis values, but also a huge range of signs, small graphics, that are displaying data like value, total or header..
Font size: The font size can be selected in the popupmenu, and the "Auto" function will auto select a font size depending on the size of the chart.
Pie Chart
Pie Chart settings: "Doughnuts Hole", "Distance to Center", "Offset",
Distance to Center and Offset: With Pie Chart, specify one or more columns in the grid to be offset to the center of pie chart, select the column by clicking on the first cell in the column, turning offset checkbox, on or off, and Then press the "Create" button, there is already a graph selected, the graph is updated and the distance to center slider can choose the distance to the center of the graph for all sections of the pie graph.
Doughnuts Hole: With the slider "Doughnuts Hole" can be set the donut hole size.
Circle Chart
Circle Chart settings: "Doughnuts Hole", "Space Between"
Doughnuts Hole: With the slider "Doughnuts Hole" can be set the donut hole size.
Space Between: Space between lines can be set.
Expanding Pie Chart
Expanding Pie Chart settings: "Doughnuts Hole", "Distance to Center"
Doughnuts Hole: With the slider "Doughnuts Hole" can be set the donut hole size.
Distance to Center: With the slider "Distance to Center" the distance to the center can be adjusted.
ShowLedger: When check box's "Show Ledger" is turned on, the slider can be set to high for the check box to indicate the size of the ledger.
Gauge Chart
Gauge Chart settings: "Gauge Size", "Meter Size"
Gauge Size: With the slider "Gauge Size" the min/max angle of the chart can be set.
Meter Size: With the slider "Meter Size" the air between meter lines can be adjusted.
ShowLedger: When check box's "Show Ledger" is turned on, the slider can be set to high for the check box to indicate the size of the ledger.
Column Chart
Column Chart settings: "Column Space", "First As Line", "Fill Chart"
Column Space: The slider "Column Space" can set the distance between columns / group of columns in the graph.
Fill Chart: Change start and stop of the graph itself. The function has real value only when used with "First As Line"
First As Line: First line of data appears as a line, note that "Column Space", indicates the bars in the Scatter section and that "Line Width" changes the line thickness in the Line section.
Bar Chart
Bar Chart Settings: "Column Space"
Column Space: The slider "Column Space" can set the distance between columns / group of columns in the graph.
Pyramid Chart
Pyramid Chart Settings: "Column Space"
Column Space: The slider "Column Space" can set the distance between columns / group of columns in the graph.
Area Chart
Area Chart Settings: "Transparency", "Fill Chart"
Transparency: The Transparency slider allows transparency for the different areas of the graph.
Fill Chart: If that graph is to be used in combination with other graphs, such as "Line Scatter Chart", it may be advantageous to scale the graph to full graph size.
Line Scatter Chart
Line Scatter Chart Settings: "Block Size", "Fill Chart"
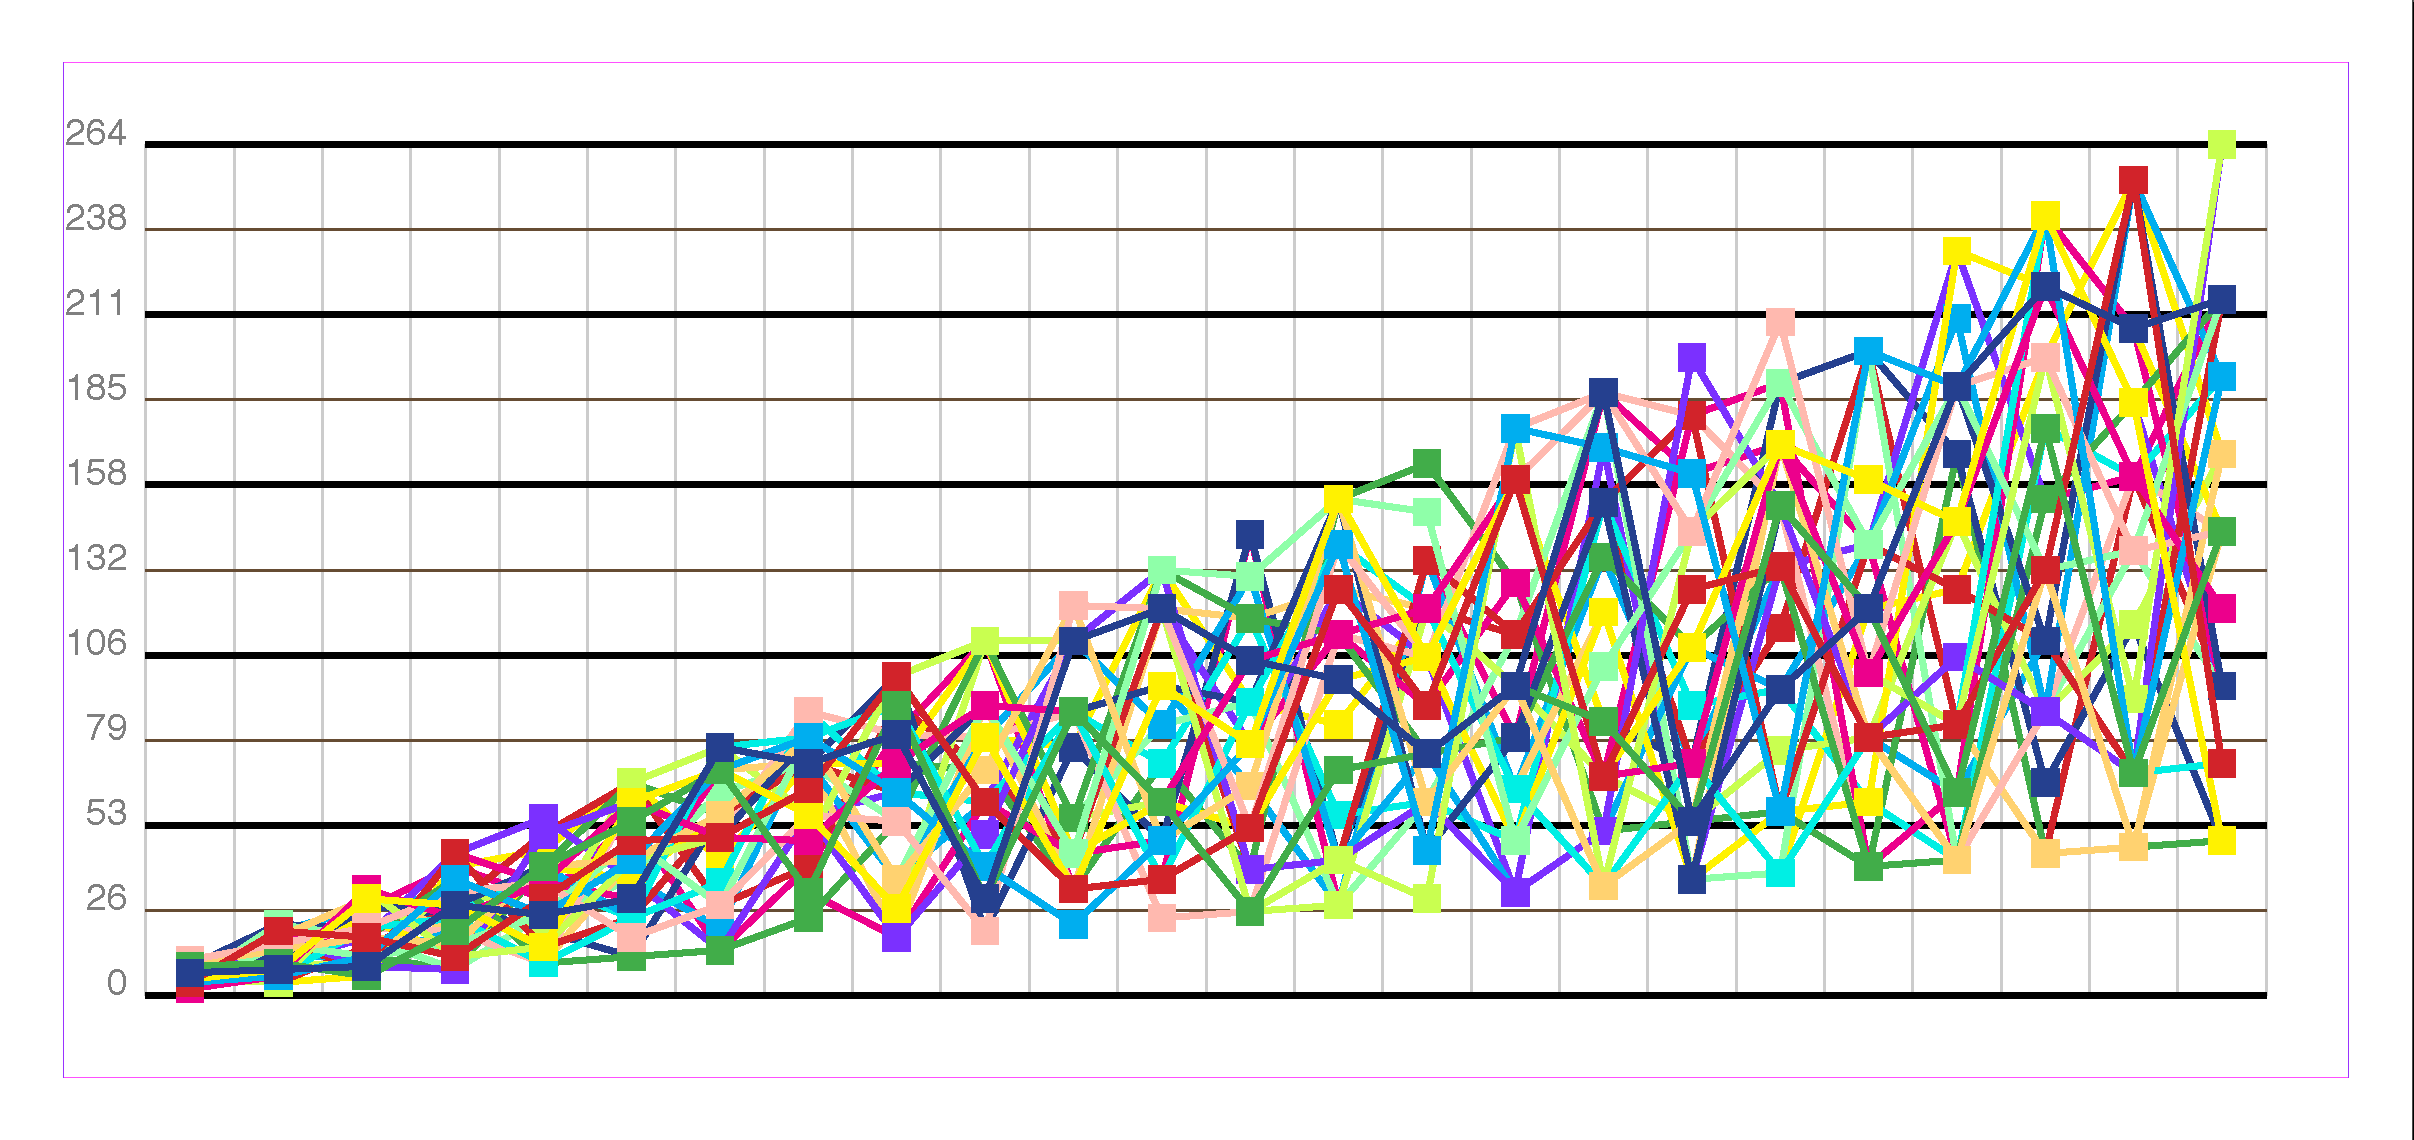
Block Size: With the "Block Size" slider, the size of blocks or Scatters can be set, a value of 0, to create a clean line graph. Valid values 0-100%, the real size of the block is based on algorithms about calculating the graph size.
Fill Chart: If the graph is to be used in combination with other graphs, such as "Column Chart" or "Area Chart", it may be advantageous to scale the graph to full graph size.
High and Low Chart
High and Low Chart Settings: "Column Space"
Column Space: The slider "Column Space" can set the distance between columns / group of columns in the graph.
For all the different types of graphs, a ledger can be displayed, with the names of the individual types of data.


