Cacidi Charts CC - At a Glance
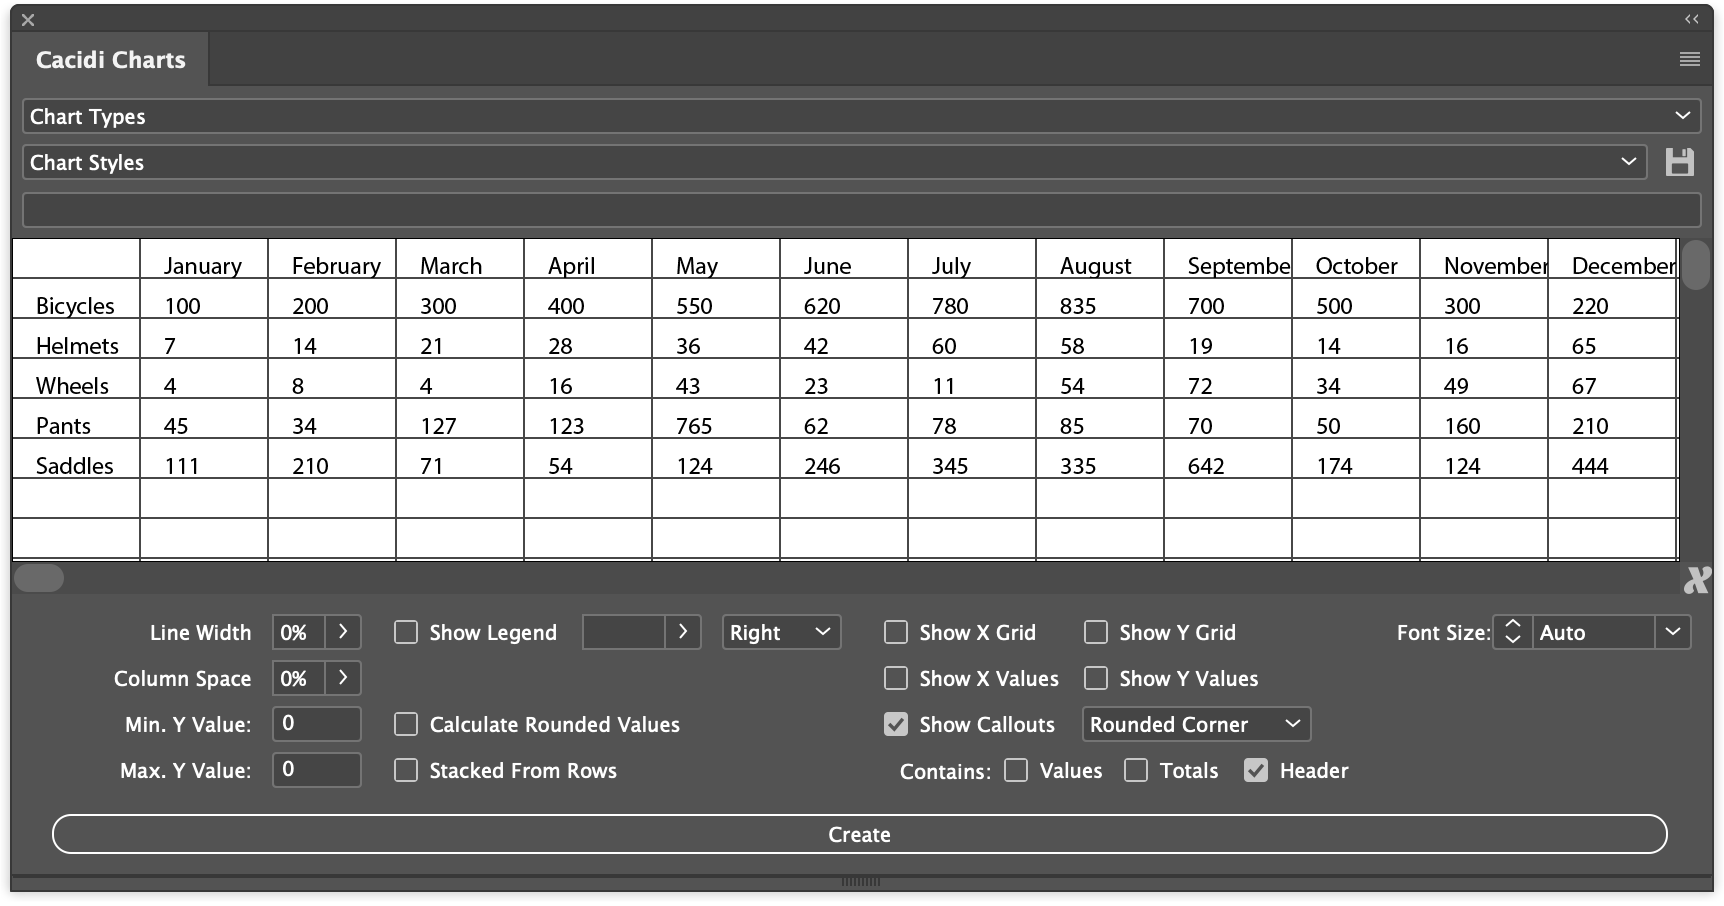
Cacidi Charts CC is a plugin that provides a wealth of good opportunity to create great and informative charts based on data entered in the palette or retrieved from CSV files.
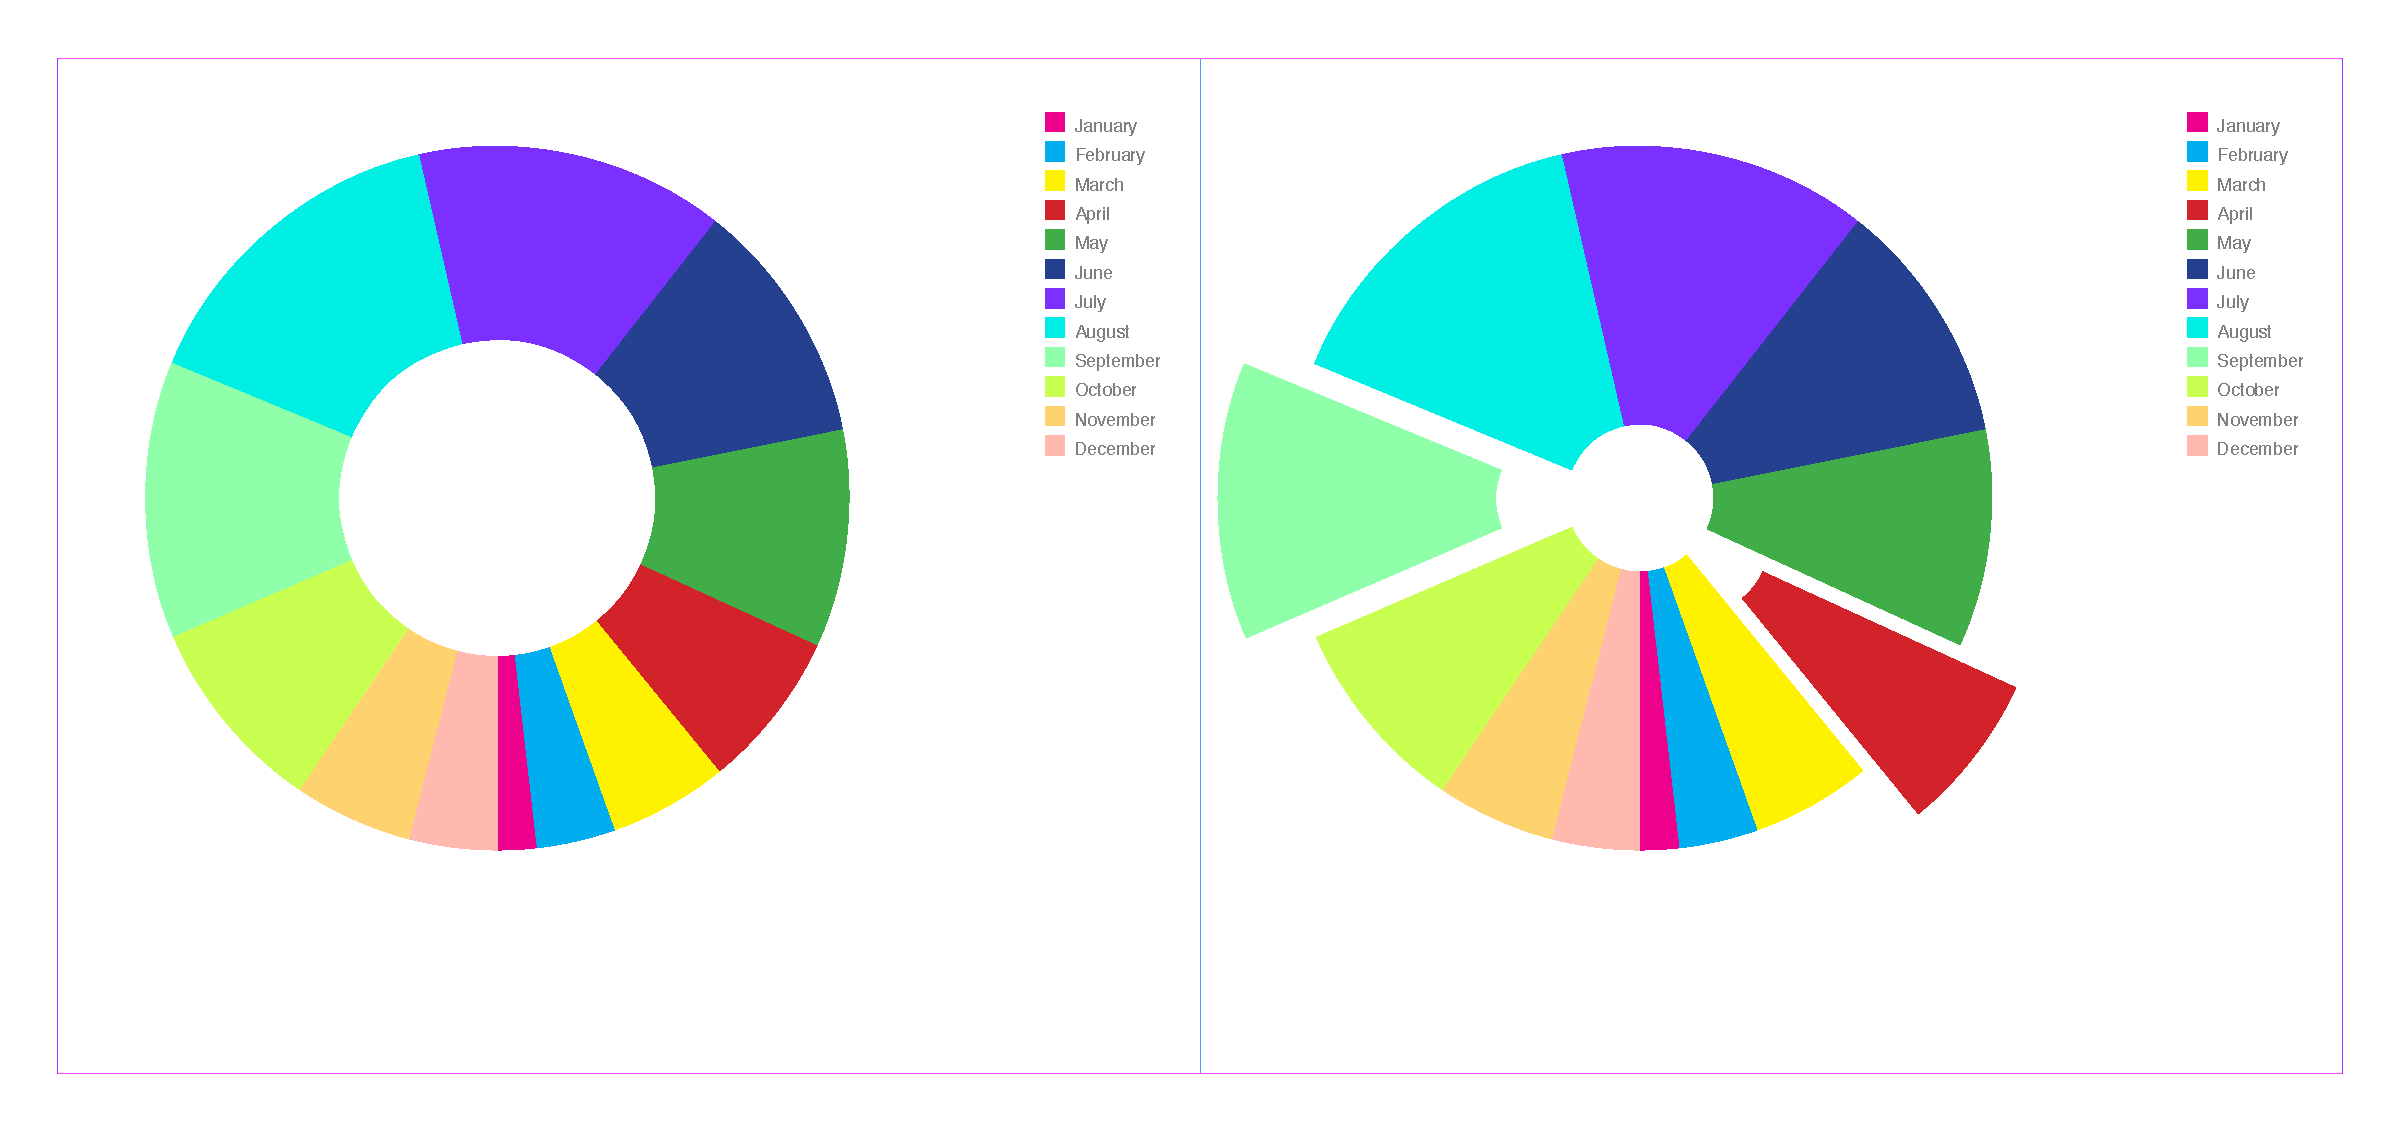
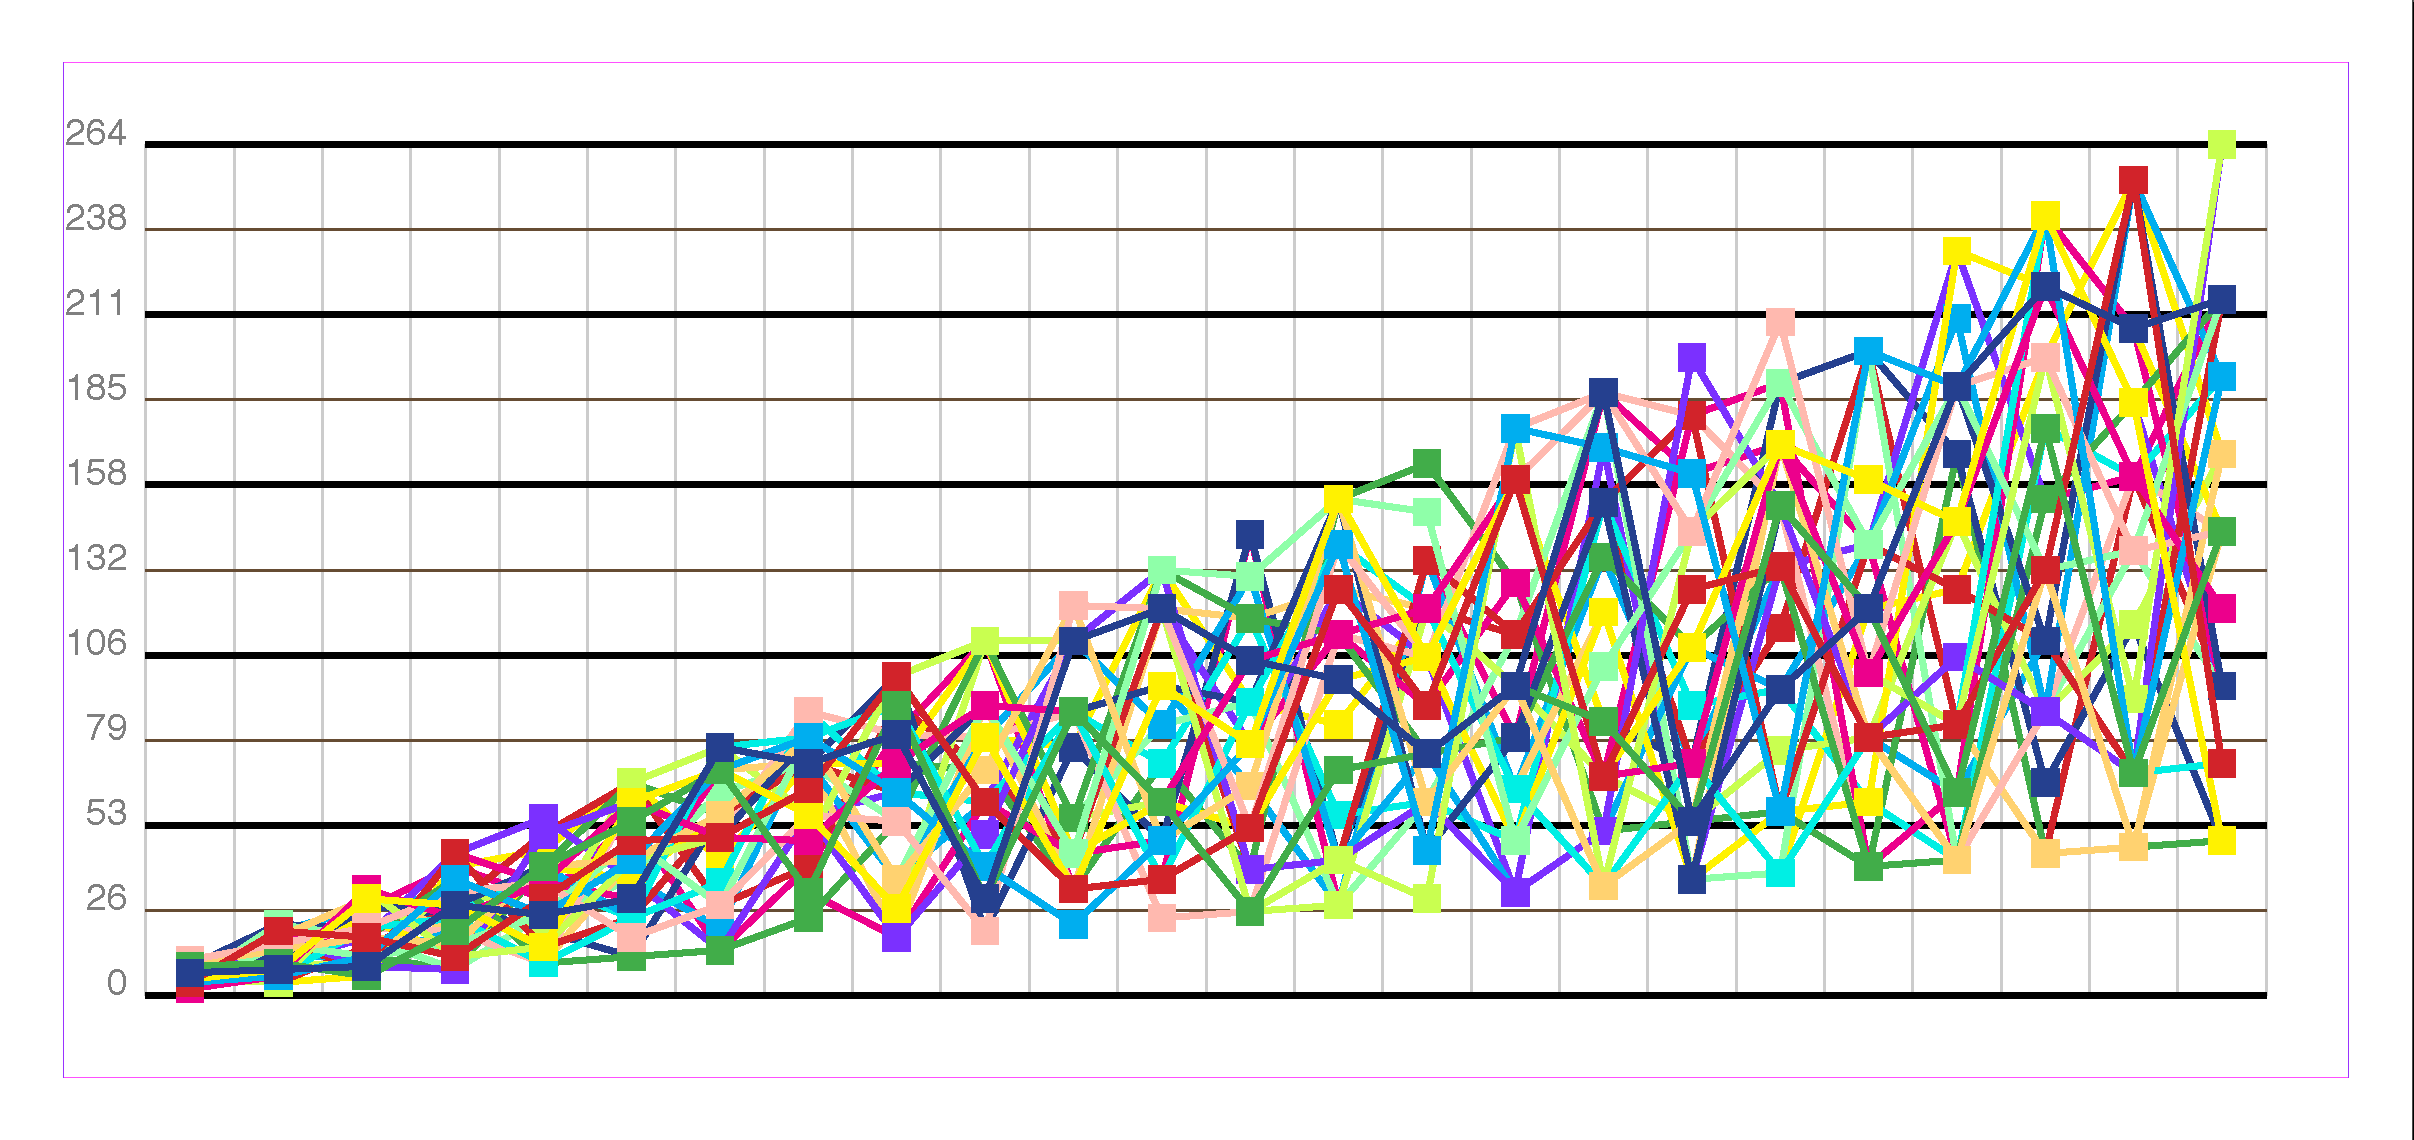
In the large selection of graphs (10 different types), you can choose between Pie Chart, Expanded Pie Chart, Gauge Chart, Circle Chart, Column Chart, Bars Chart, Pyramid Chart, Area Chart, High and Low Chart, Line Chart or Scatter Chart.
A wide range of adjustment options, for example, options to have lines behind the graph shown, distance can be adjusted between columns or whether values are displayed. All changes applied are displayed in real time and can be easily adjusted.
Font Size can be auto set, depending on the size of the chart, or set to a specific size.
Text information can be shown in a wide range of ways, and there are 9 different types of call-outs.
Cacidi Charts CC provide graphs that are alive. Adjust data, chart type or settings, and the result is seen instantly. Also, if the graph is scaled out of proportions, the form and content are dynamically re-computed, and text in the graph is never distorted.