
TRY THE BRAND NEW CACIDI CHARTS – 10 TYPES OF CHARTS – 9 TYPES OF CALLOUTS – NEW COLOR ENGINE – NEW TEXT ENGINE – 30 DAYS FREE TRY-OUT!!
Cacidi Chart is a World Class tool for creating all sorts of charts
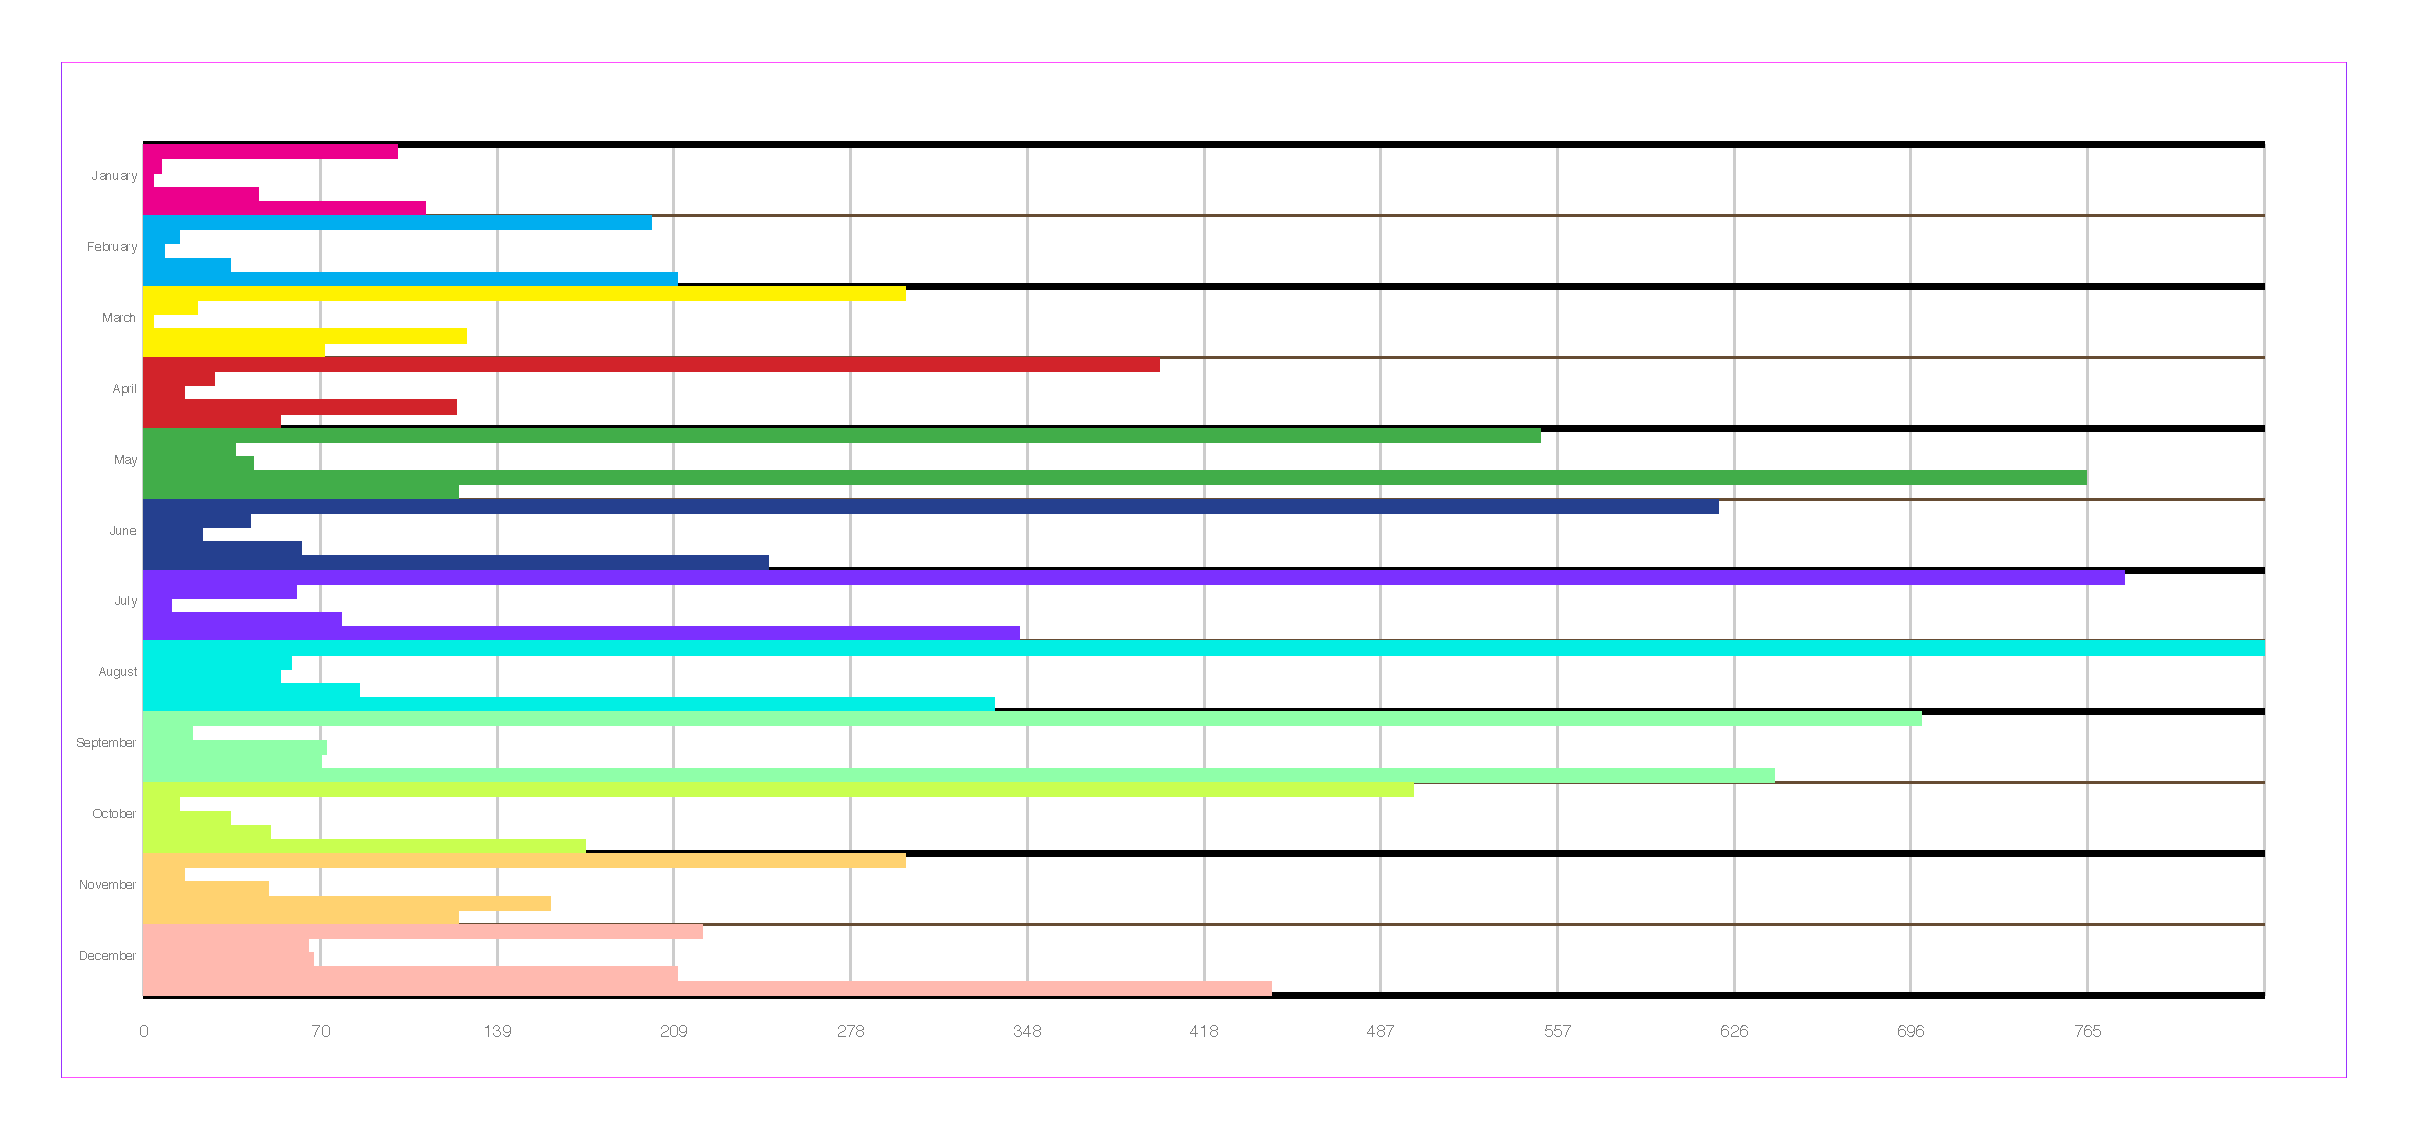
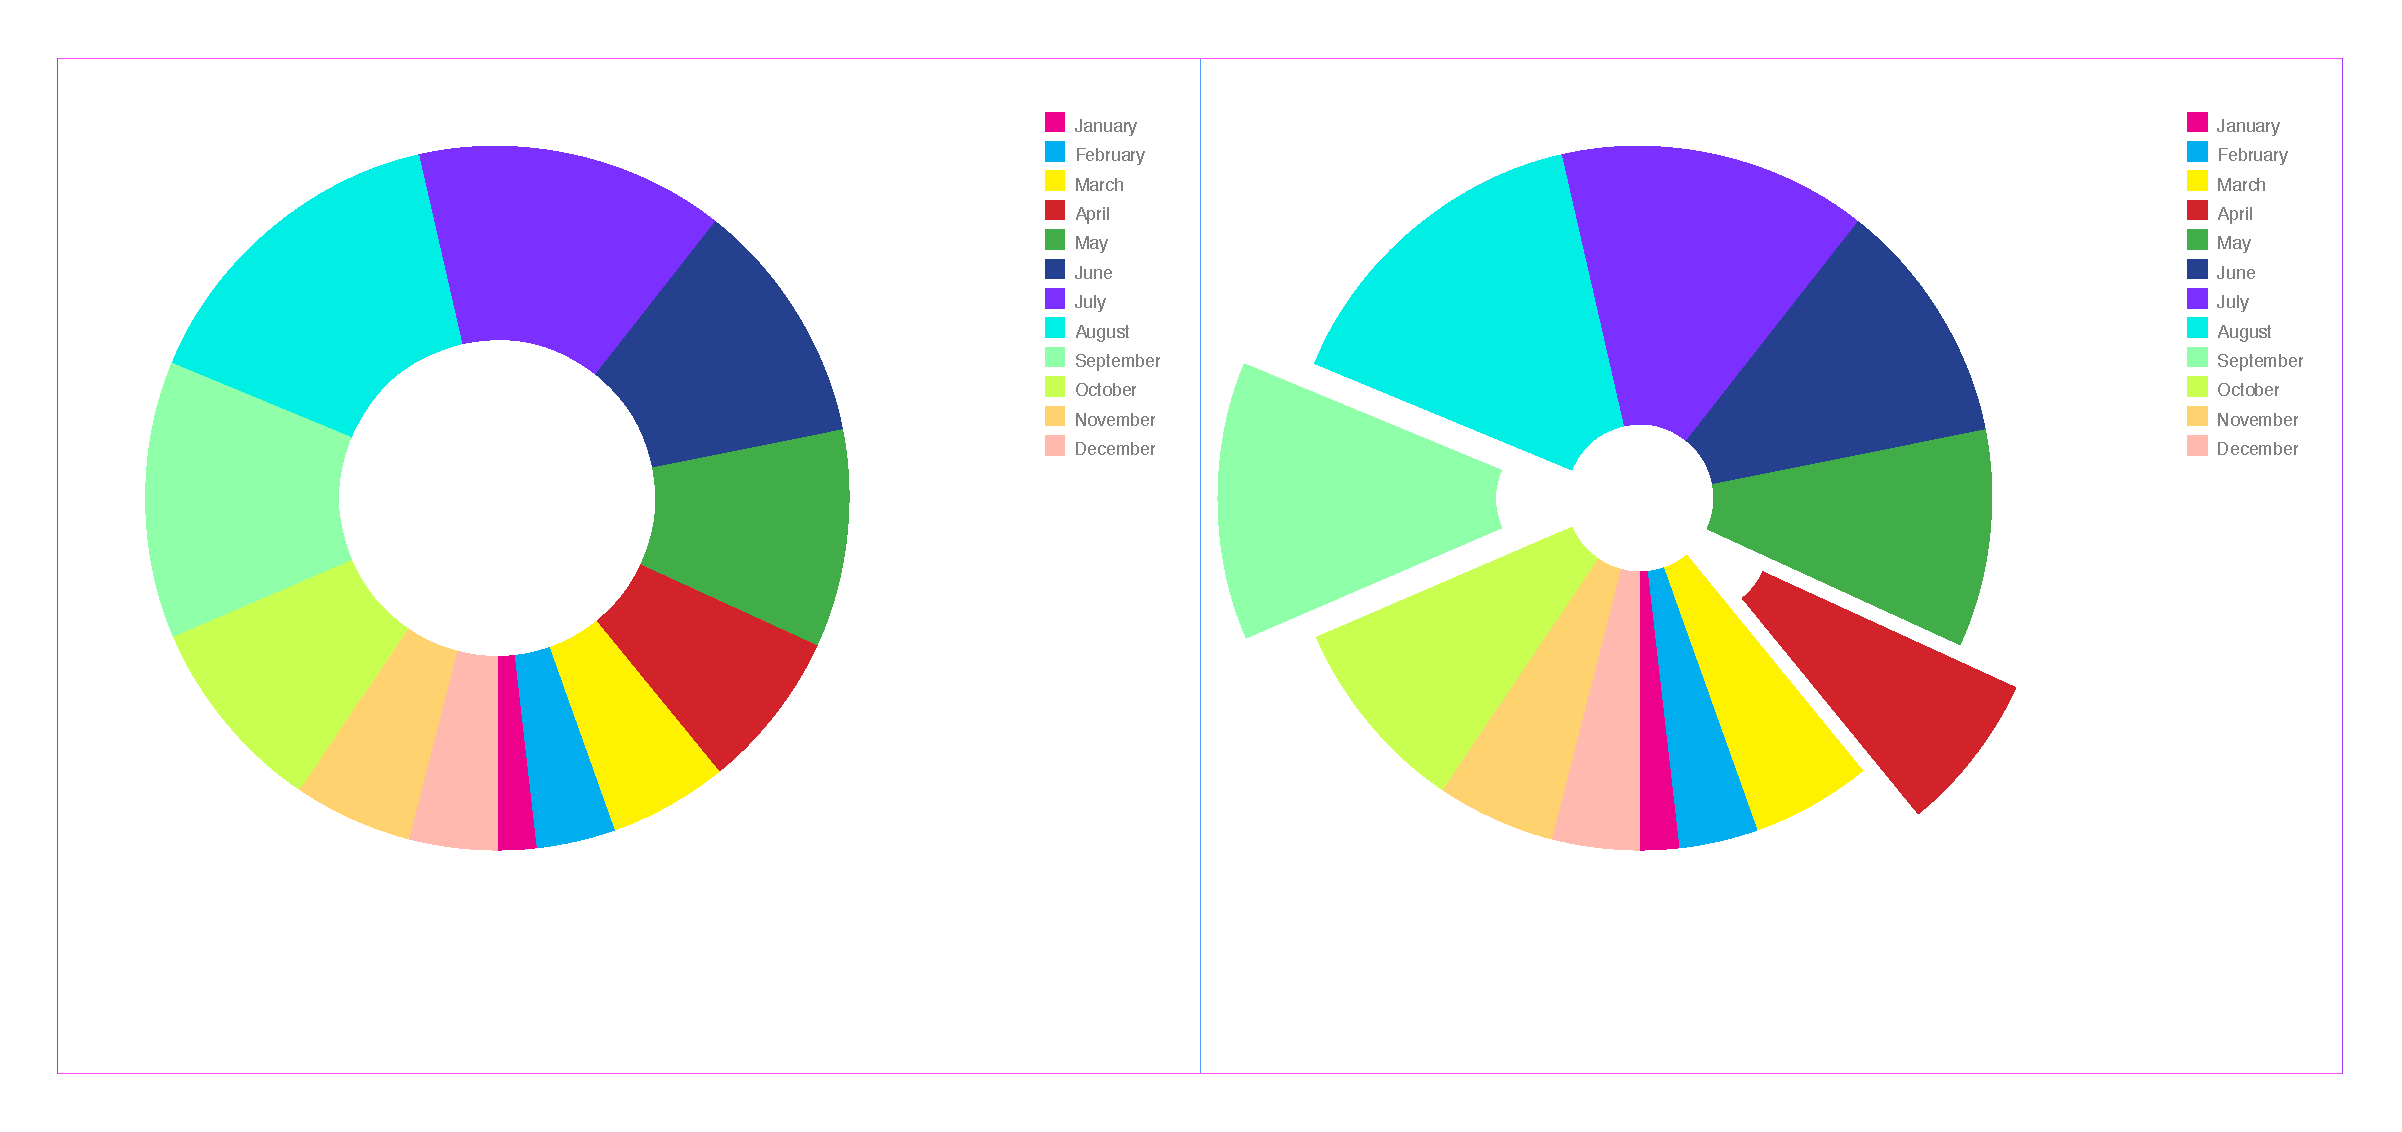
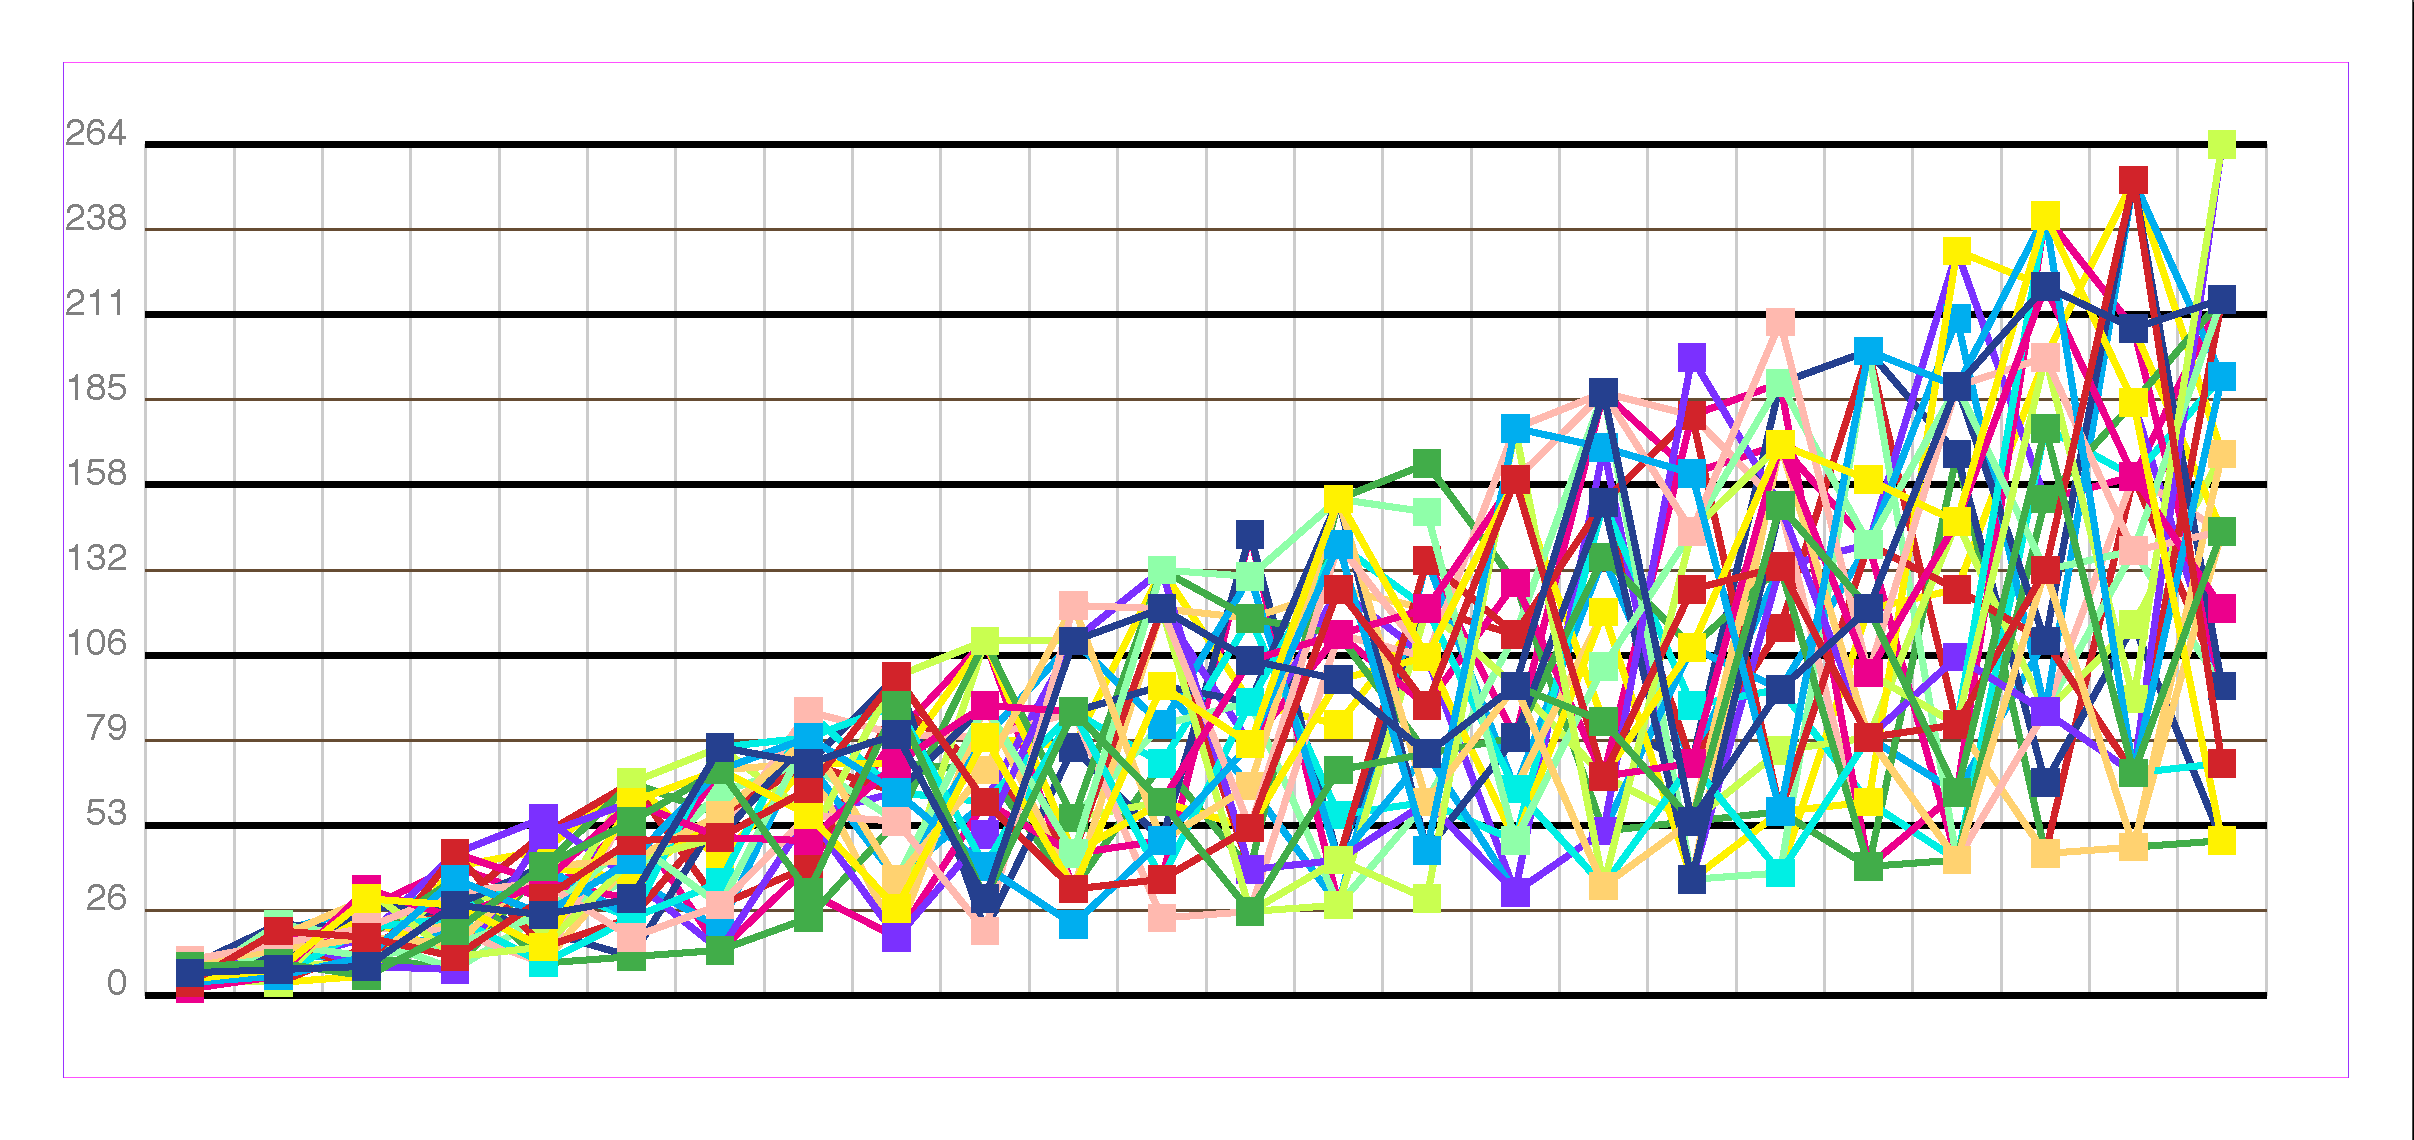
The Cacidi Charts CC gives a wide range of charts like Pie Charts, Expanding Pie Charts, Circle Charts, Gauge Charts, Column Charts, Bar Charts, Pyramid Charts, Area Charts, High and Low Charts and the combined Line Scatter Charts.
| Cacidi Charts CC2023 | $135 per seat/per year | Add to Basket | Download Now |
Ease of Use
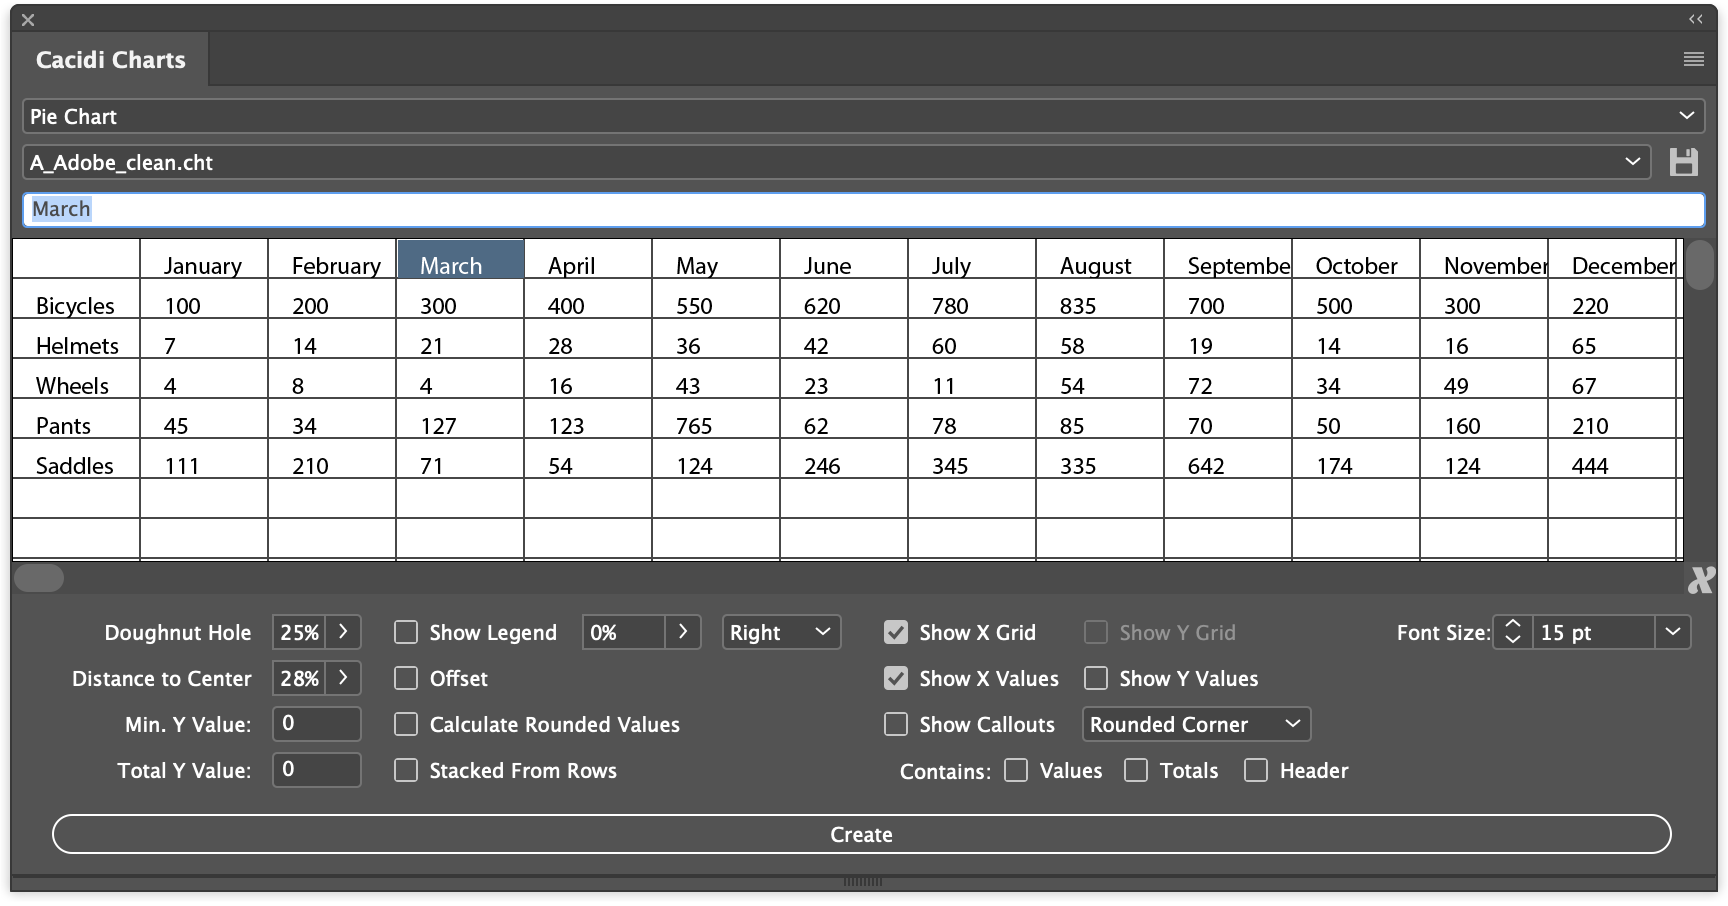
Cacidi Charts CC is an easy to use tool, just select Chart Type, enter data in the grid, press the “Create” button and a super smooth antialiasing chart appears on the selected page. Want to edit the data or the style – select the chart, make the adjustment, all settings are done in real time, want to edit the data, click the cell, make the change, and press the “Create” button to update the data.
Creative freedom
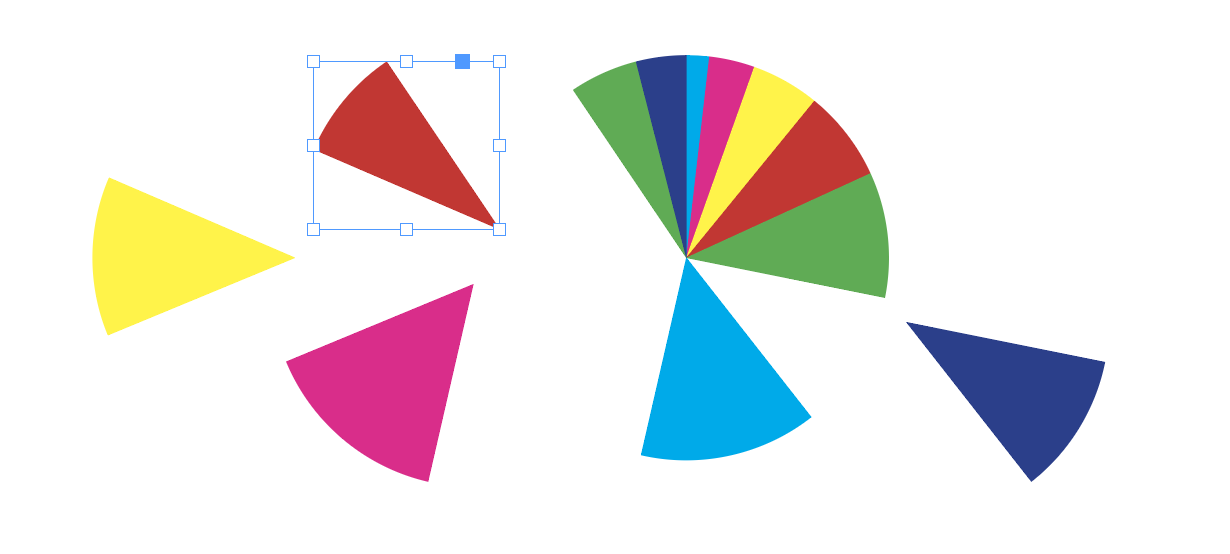
The charts can be puzzled in so many ways, and the adjustments and styling are eminent. The adjustment depends on the chart type chosen e.g. The doughnuts hole can be adjusted for pie type but not for columns chart, but here the space between can be set.
Call-Outs
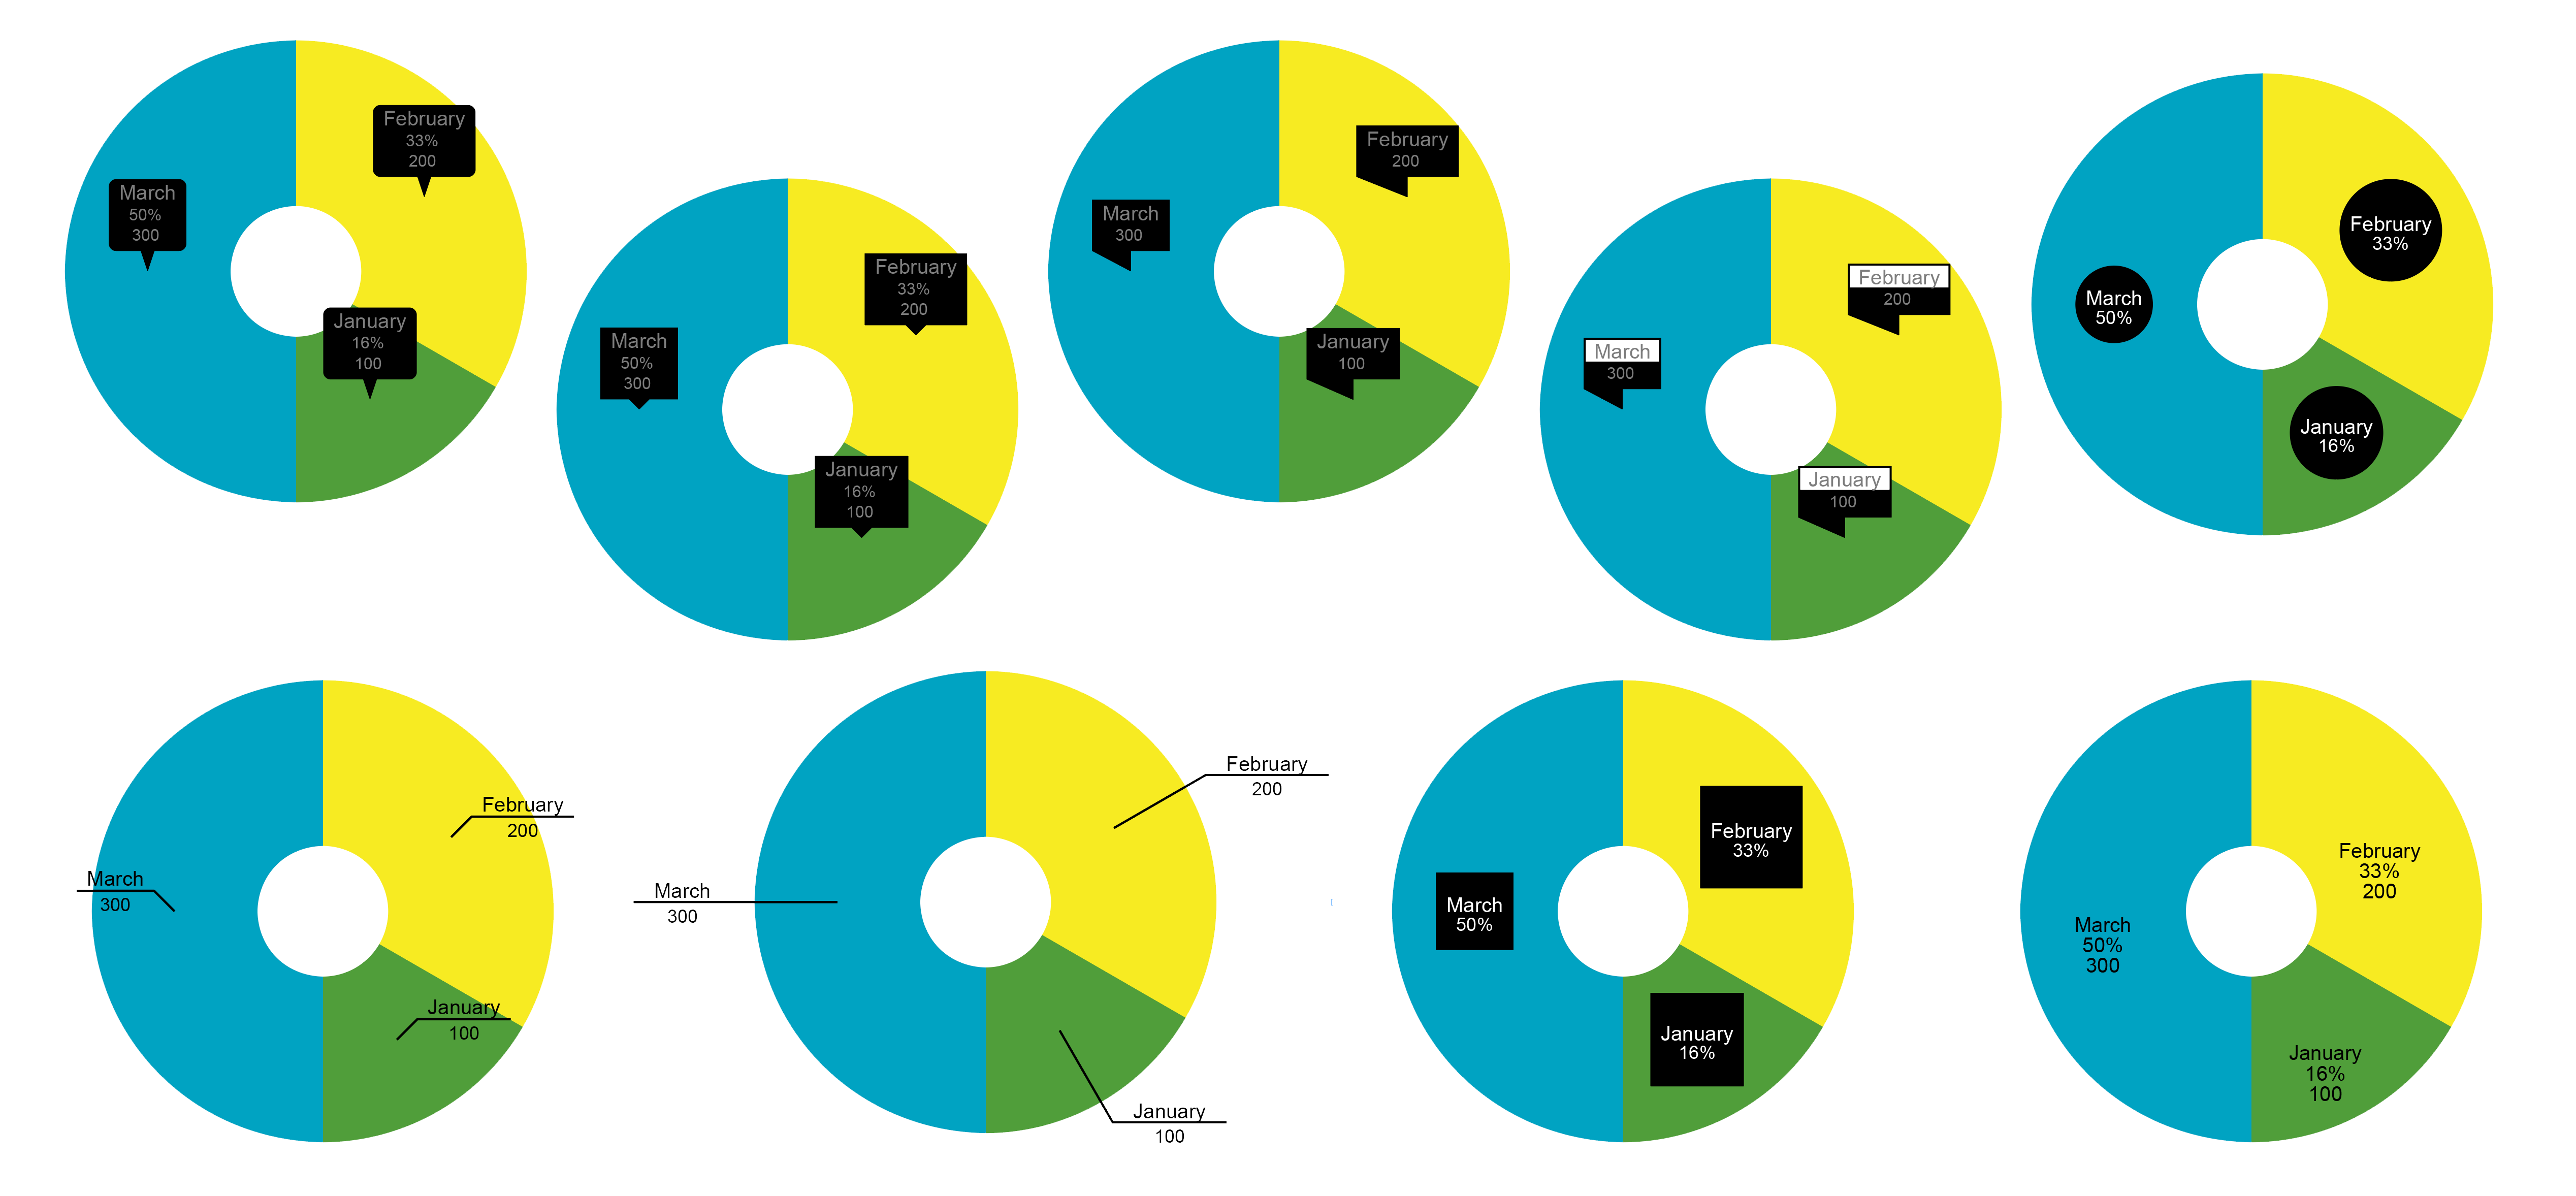
There are nine types of different call-outs to display your data for the values, and adjustment which data should be shown.
Advanced Text Engine
The text engine are responsible for showing the data on the charts and do a lot things like, giving you the ability to have nice rounded values or exact values, auto truncate lang description, but also let you set choose exact font size.

Live Objects
Cacidi Charts gives live update of all settings, data as well as appearance can easy be adjusted and all are on-the-fly redrawn. Size adjustment of the charts will auto redraw and e.g. lines in the background will using our custom algorithm be re-calculated.
Create a Chart style
A chart style can contain colors and the font type for the chart. It’s easy to create a style, and easy to apply it to the chart. To create the style simply, create a serie of text frame, insert a few letters in the boxes with the font type. Apply different colors to the boxes. Now select the boxes (black arrow), and click the save icon next to the Chart Style popup.
Load and save data
Data for the data grid can be loaded to the grid by using the “Load CSV file”, and saved back after editing using the “Save CSV file”
The data in the data grid can be placed as a styled InDesign table with the “Place Grid Data As a Table”.
Convert Charts to InDesign Objects
The “Convert Charts to Objects” menu function makes it easy for you to convert the live object format to InDesign elements for safe distributing or creative manipulation.
Chose which objects you want to convert by selection them, and if you haven’t selected anything, all charts in your document are converted to standard InDesign elements. You can use converted elements for creative alterring or safe distribution.
When converting you chart, the original Cacidi Chart objects are moved to an auto created layer named “Cacidi Charts”, so you always are able to make adjustment on values or appearance, using the original chart.