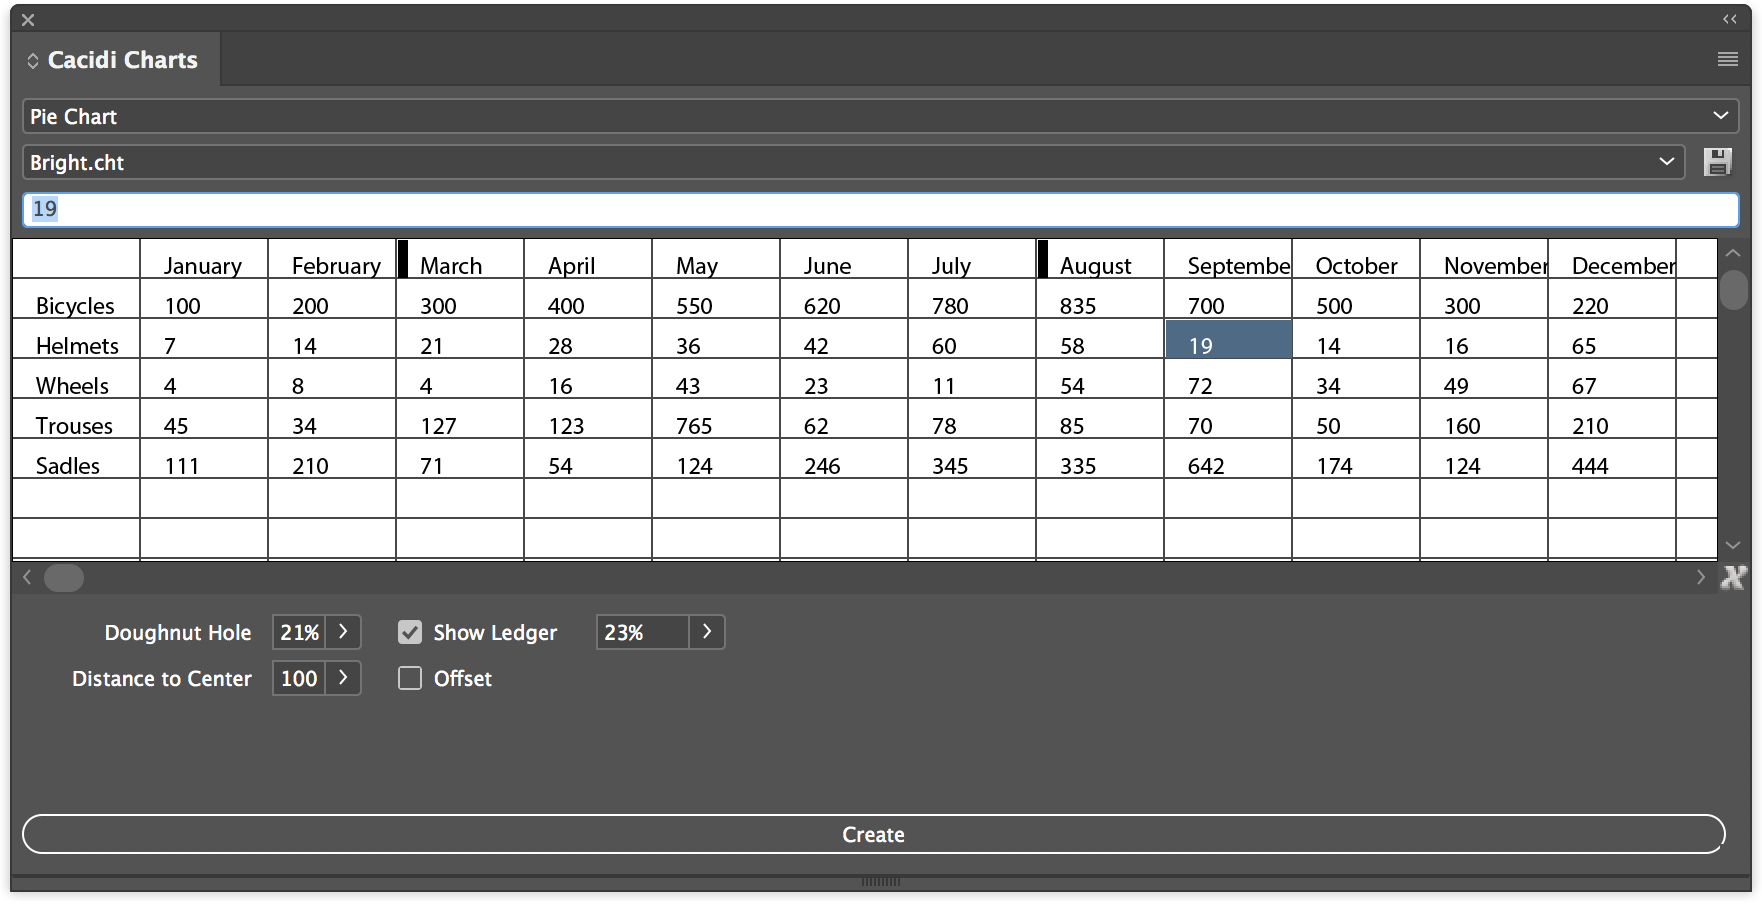
To work with the input grid
Cacidi Charts CC basically works with three different types of data. Data for the graph itself, which are values in speech, Header and Ledger, which is headline / data description as letters. The header is typically the first line in the grid. The leader is typically the first column in the grid.
The difference between Ledger and Header
Ledger is data field headings lying over data, Ledger is data located to the left of the data line. The header is often used below, for example. Column graphs and describes the group of info. The leader is a separate widget that can be displayed as a color block, the color is used in the graph, along with the description of data.
Entering data
Data is entered in the input grid by clicking on a cell, then the activation field is active, enter data and exit by pressing enter (line key key on the keyboard), the selected cell will jump to the next cell in the column. Data for Ledger must contain letters (a, b, c ..) and data for the graph itself must contain only numbers (1,2,3 ..). If there are only numbers in the Header / Ledger insert a space, then at Cacidi Charts CC that there is a Header / Ledger info.
Navigation in the Grid
The arrow keys (left, right, up, down) can be used to navigating in the grid.
Deleting column or rows
Right click in the first column or row will popup the contents aware menu, given the possibility to insert or delete a column or row.
Deleting all data in the entry grid
Pressing the small "X" icon in the lower right corner of the grid resets all data in the grid.
Shortcut to download demo / test data
By combining keys held down on the keyboard cmd / ctrl, shift and all keys, while clicking the "X" icon, the data in the grid will change and new graphs can be produced.

