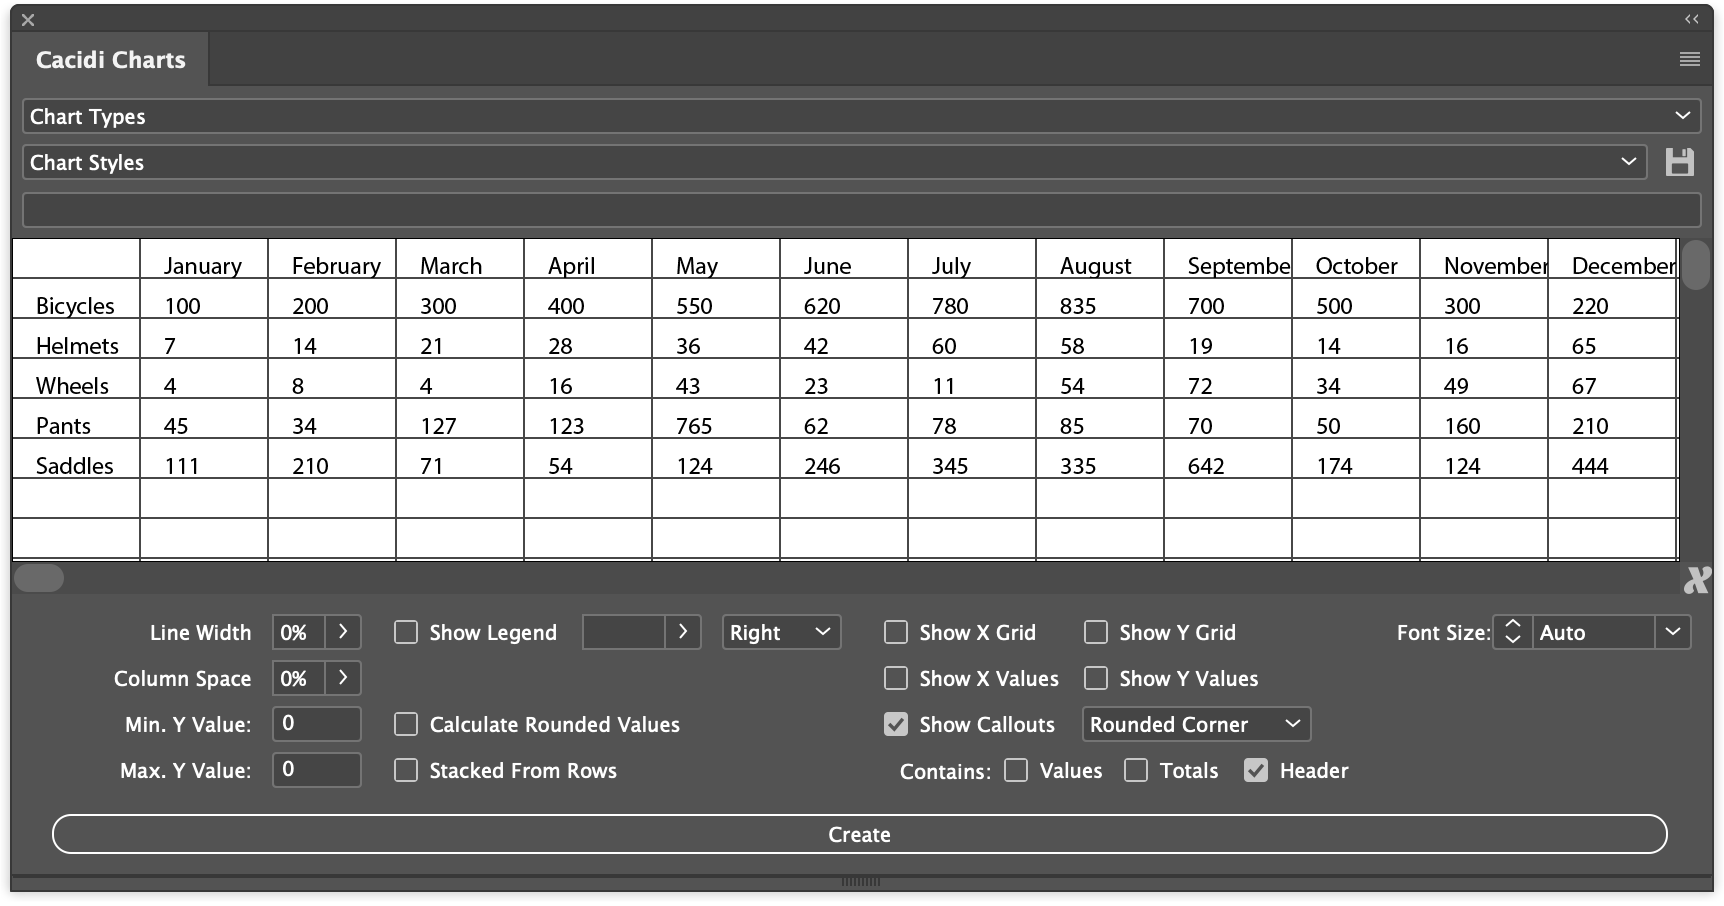
Cacidi Charts CC palette
The Cacidi Charts CC panel consists of two popup menus at the top of the panel. "Chart Types" and "Chart Styles". In the middle of the panel you will find the input grid, with the corresponding input field just above. Below the input grid there is a group of elements that vary depending on which graft type is used. Finally, the "Create" button is found.
"Chart Types" allow chart types to be pie chart, column chart, bar chart, stacked chart, area chart and line scatter chart.
"Chart Styles" here select which color scheme the graph should apply, as well as the "Save" icon for creating color schemes.
The input grid is where data is entered and maintained.
Adjustment features can be regulation transparency for Area Charts, space between columns for Column Charts or Doughnuts Hole for Pie Charts. See below for Graphing Options.
"Create" button used to create a graph or update data / offsets to an existing graph.

